

MINING IN IRAN
i. MINES AND MINERAL RESOURCES
Archeological surveys indicate that Iran was among the leading nations in mining activity in ancient times (ʿAlipur, 1993-94). Its ancient civilizations, richness of natural resources, and records of ancient mining and metalworking are testimonies to such a claim (Zāvoš, 1976-77). The history of mining in Iran can be divided into two periods.
The first, the ancient and pre-modern period, is evidenced by abandoned mines where modern Western techniques and equipment, such as earthmoving machinery and explosives, were not deployed (Qorbāni, 2002-03). Such mines can be grouped into three categories based on the materials extracted: (1) mines of metallic ores: iron, copper, gold, lead, zinc, and silver; (2) non-metallic mines and quarries of china clay (used in ceramic and tile making), gel-e saršuy (a variety of bentonite used as soap in ancient Iran), and bentonite and serpentine (used in clayware); (3) mines of precious and semi-precious stones, such as firuza (turquoise), zabarjad (emerald), dorr-e kuhi (quartz), kamast (amethyst), laʿl (spinel ruby), yašm (jadeite), yāqut (ruby), and safir (corundum).
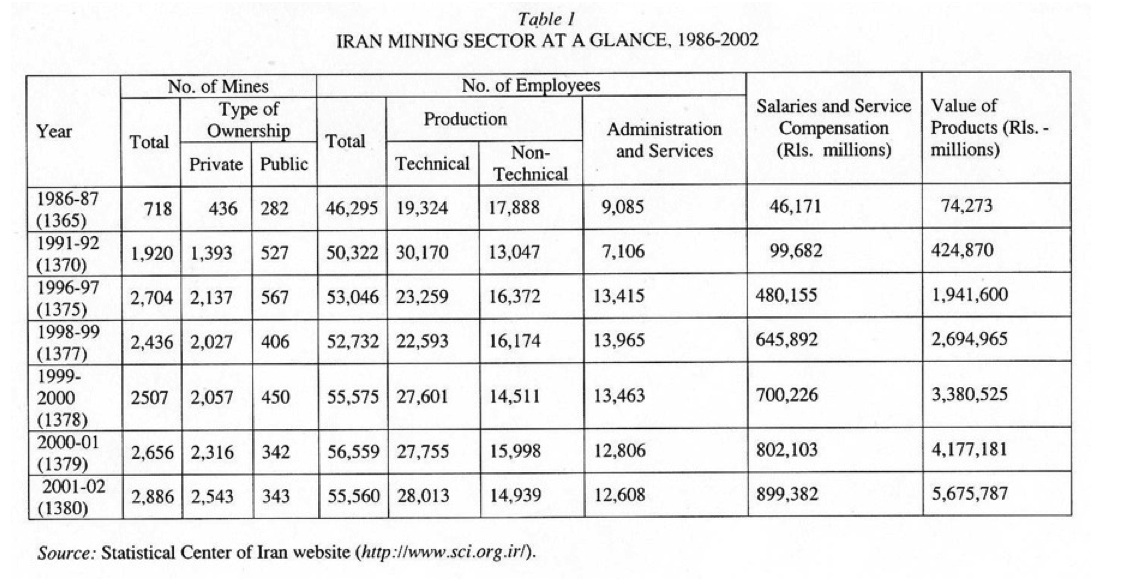
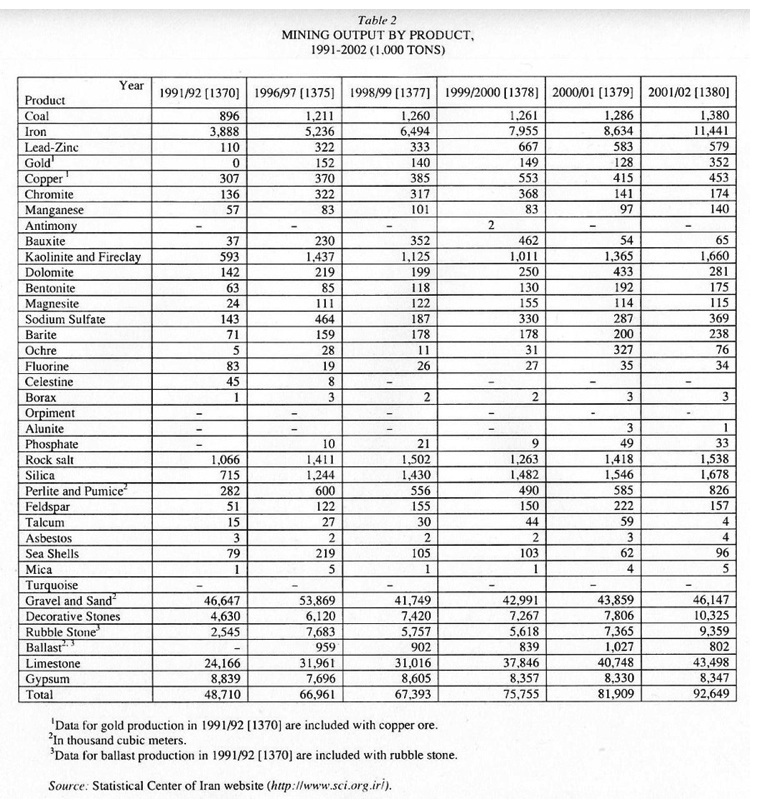
The second, the modern mining period, is marked by utilization of Western techniques. These activities began at the time of Fatḥ-ʿAli Shah (r. 1797-1834) through the efforts of ʿAbbās Mirzā (d. 1833), the crown prince; but they fell more or less dormant until Reżā Shah’s (r. 1925-41) time. Then, with the onset of modernization of the country based on Western principles and the establishment of various metal industries, modern mining activities were initiated to supply an increased demand for raw materials. These efforts have continued to the present; as a result, more than 4,000 ore deposits and indications are known to exist in the country (Qorbāni, 2002-03). This number includes sites which are inactive, mined out, or not yet worked. Table 1 shows the status of the country’s mining sector as per government statistics, and Table 2 shows production figures from recent years.
Share of the mining sector in the Iranian economy. Considering the wide range and diversity of mining products of the country and Iran’s international position among the resource-rich countries, one would expect the mining sector to play a pivotal role in the country’s economy. Owing to the dominance of the oil sector, however, the share of the mining sector has been reduced to a negligible figure.
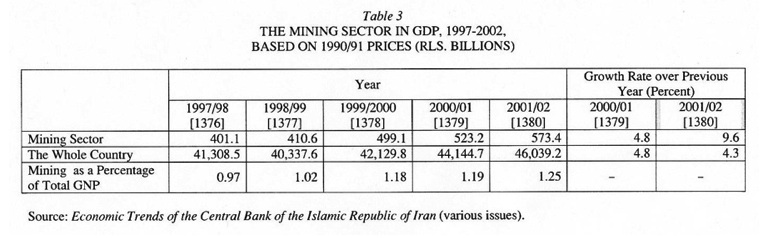
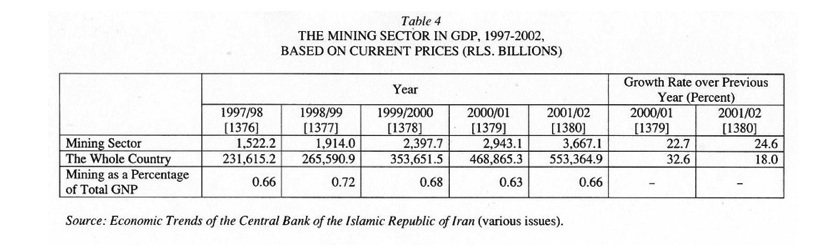
It can be seen from Table 3 and Table 4 that during the period 1996/97-2001/02 (1375-80], the highest share of the mining sector in the Gross Domestic Product (GDP) of the country based on current prices was 0.72 percent (for the year 1998/99 [1377]), while the highest share based on the fixed prices of 1990/91 [1369] was 1.25 percent (for the year 2001/02 [1380]). Interestingly, the share of the mining sector during the same time period based on current prices has always remained around 0.66 percent, whereas the figures based on the fixed prices of 1990/91 [1369] increased from 0.97 to 1.25 percent. This can be attributed to the lesser increase of prices in the mining sector as compared to the general trend of inflation in the country. Due to the increased production of the mining sector and stable prices, the share of the sector in the GDP of the country based on current prices has remained more or less unchanged. Taking into account the natural riches of Iran, the mere 1 percent share of mining in the GDP of the country points to under-utilization of this sector.
The small percentage of GDP, like the employment figures of Table 1, reveals the insignificance of mining for job creation in the country. Although the number of active mines in Iran increased fourfold during the period 1986/87-2001/02 [1365-80]), the number of employees in the mining sector grew by only 10 percent. Whereas in the year 1986/87 [1365] an average of 64 employees were engaged in every mine, in the year 2001/02 [1380]) the figure was reduced to 19. The trend is partly ascribed to increase in the number of small private mines that employ a smaller workforce, but improved technology and deployment of modern mining equipment is the major factor in the lower than expected number of employees. This can be better understood when the ratio of technical to non-technical workforce is taken into account. During the 15-year time interval 1986/87-2001/02 (1365-80), the non-technical employees of the mines declined, while the technical as well as the administrative staff have grown.
On the other hand, a comparison of the growth rates of mining products from 1986/87 to 2001/02 (1365-80) attests to the technological advancement of the mining sector. Ever since 1996/97 (1375), the production growth rate has been higher than the rate of growth of the number of mines, despite the reversed trend during the years 1986/87-1996/97 (1365-75). Examination of the growth rate of the value of the products compared to their volume, 1991/92-2001/02 (1370-80), along with the increased number of active mines, demonstrates that, up until 1996/97 (1375), investment in smaller mining firms was on the agenda, but subsequently large mining operations were favored by the government. Moreover, the volume-to-value ratio indicates that the operations have tended towards exploitation of higher-valued mining materials. All the above-mentioned facts point to the deployment of a more comprehensible and orientated mining policy since 1996/97 (1375).
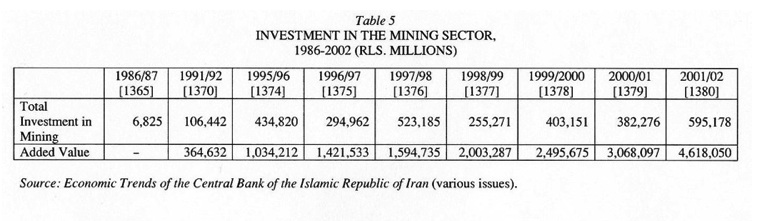
The value-added of the mining sector for the year 2001/02 (1380) amounted to Rls. 4.618 trillion, while the per-employee value-added stood at Rls. 83.12 million, which shows a very high rate of return on investment in this sector. Table 5 lists the amounts of investment in the mining sector of the country in 1986/87-2001/02 (1365-80); fluctuation in investment has resulted in the economic instability of the sector.
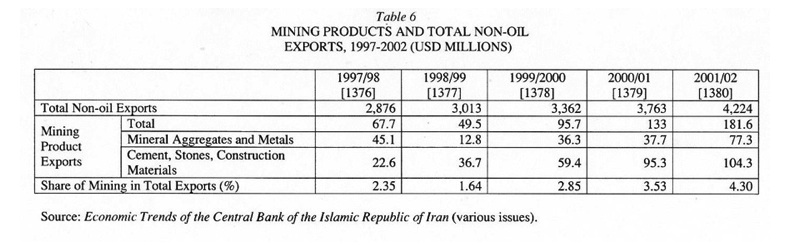
Because of the above-mentioned under-utilization, the mining sector has had only a small share in the non-oil exports of the country. The total of mining exports rose from USD 67.7 million in 1376 to USD 181.6 million in 2001/02 (1380), and the share of the mining sector in overall non-oil exports over the same interval increased from 2.35 percent to 4.30 percent. Table 6 lists the performance of the mining sector in the non-oil exports of the country.
It is evident from the above-mentioned facts and figures that the contribution to overall non-oil exports by the mining sector, both in volume and in value of products is not in proportion to the country’s position among those rich in natural resources.
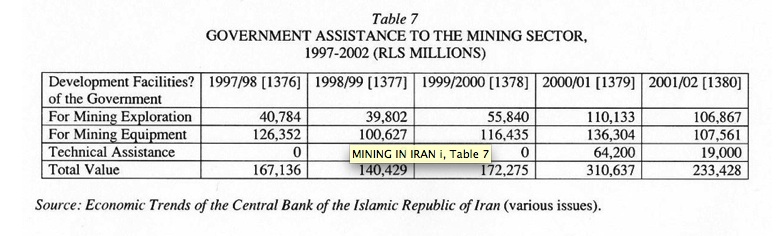
Long-term creditsextended by government financial institutions to the mining sector are presented in Table 7. Since the figures are not in accordance with the actual need (see below) of the sector, the desirability of deregulation and private investment, as well as foreign investment, cannot be denied. Nevertheless, the role of the government in exploration and research should be further strengthened.
The quantity and quality of the proved mineral resources of the country and the relative position of Iran among countries rich in natural resources on one hand, and the small share of the mining sector in the GDP, employment, and exports of the country on the other, reveal the need for further investment in the sector. In view of the limitations of government funds and credits, the need for foreign investment is obvious. However, the restrictions imposed by the constitution of the country on investments by foreign financial institutions have formed the major obstacle to government disinvestments, leading to a weakening of this important sector of the economy.
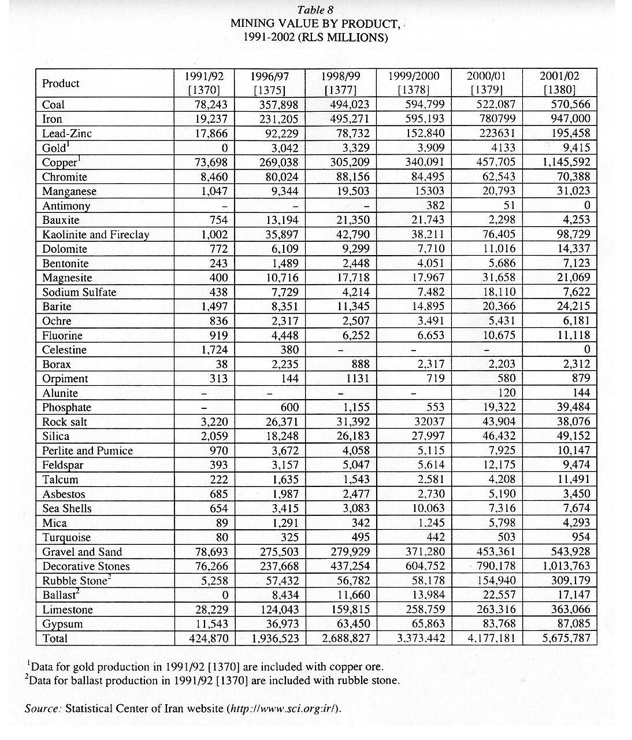
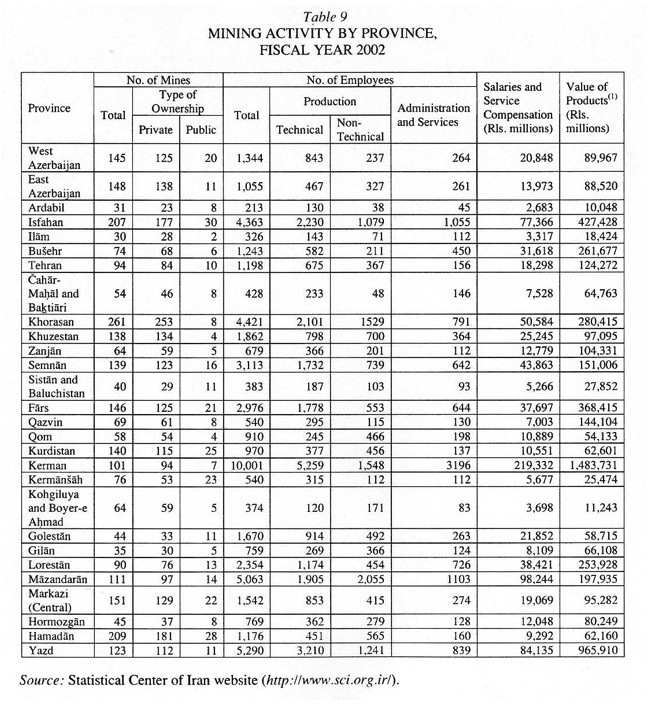
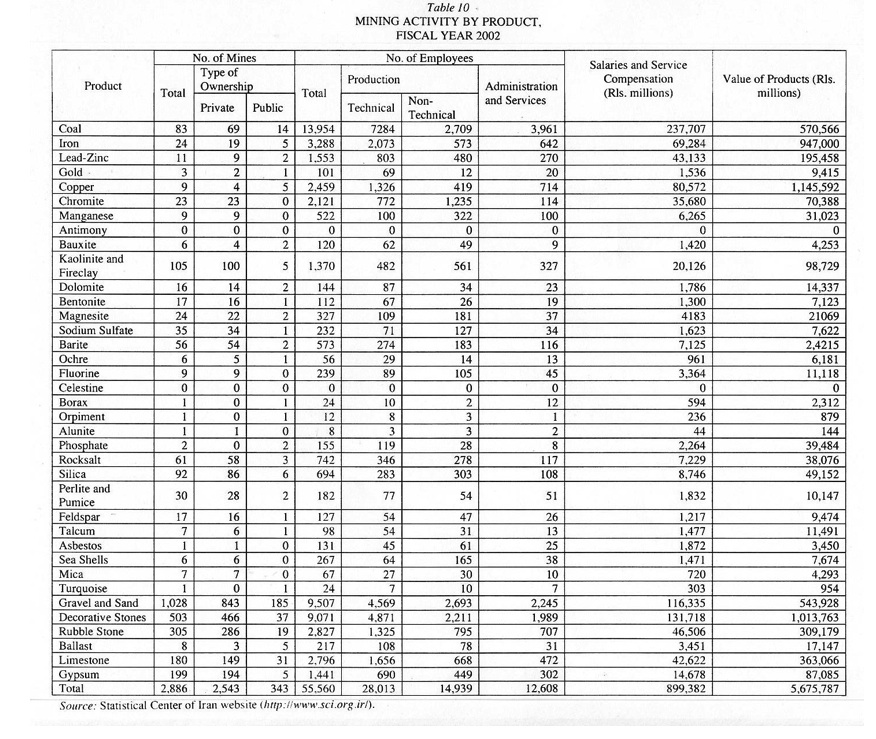
Table 8, Table 9, and Table 10 summarize other information available for the mining sector as per government statistics.
Mineral resources of Iran. In the following tables, the results of economic geological investigations and statistical reports on the known mineral deposits and indications of Iran, encompassing metals, non-metals, and fossil fuels, are compared with world mining statistics. These illustrate the position of the country in resources, production, and trade of various mining products. Though the information on Iranian mines is collected from various published and unpublished reports presented at national and international levels, it comprises only the best estimates obtainable and not the exact numbers resulting from scientific research. It has been attempted to compile all the available data on Iranian mines and compare it with the world data extracted from World Mineral Statistics 1993-97 (Stockwell, 1999) and Minerals and Materials Information (USGS, 2003). Particular attention has been paid to the qualitative aspects of some minerals.
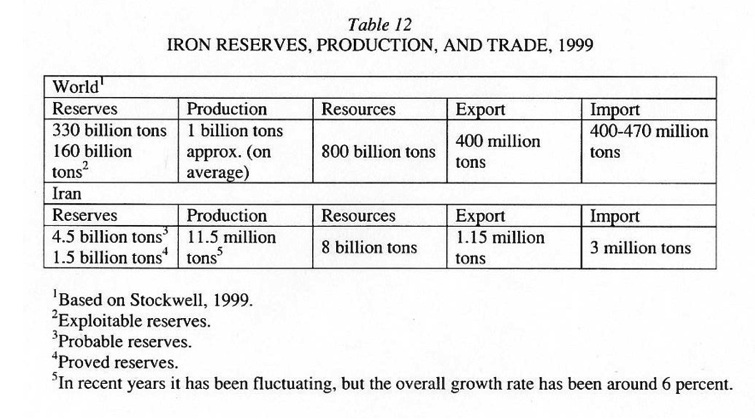
Iron. Over 200 ore deposits, indications, or anomalies of iron are recognized in Iran, whose reserves amount to almost 4.5 billion tons of iron ore. The average grade of iron in these reserves varies from 45 to 60 percent. More than 90 percent of Iran’s iron ore deposits are located in three provinces listed in Table 11, while Table 12 presents a comparison of Iran’s iron ores with the rest of the world. The share of Iran in worldwide iron reserves stands at 2.7 to 3 percent, while its share in world production varies form 0.9 to 1.0 percent.
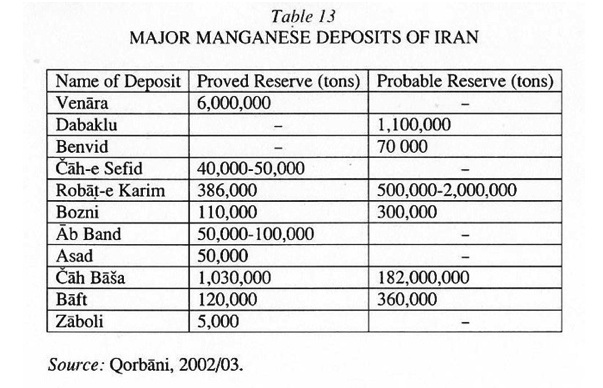
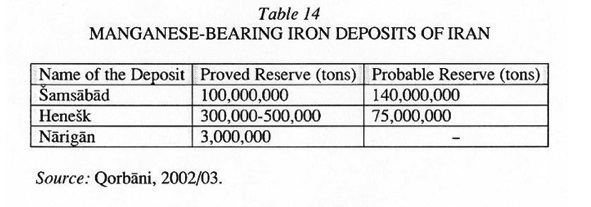
Manganese. Over 45 ore deposits and indications of manganese are recognized in Iran, out of which 10 deposits are of medium tonnage, and the rest are either small deposits or indications revealing the fact that Iran is poorer in terms of manganese as compared to iron. Therefore, although iron production has gone up in recent years, manganese production has stayed unchanged. However, new exploration might result in discovery of valuable manganese ore deposits. Table 13, Table 14, and Table 15, respectively, illustrate the most important manganese ores, manganese bearing iron ores, and the status of manganese production in Iran.
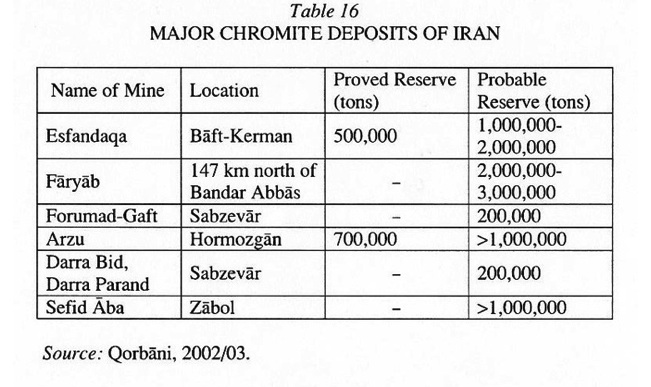
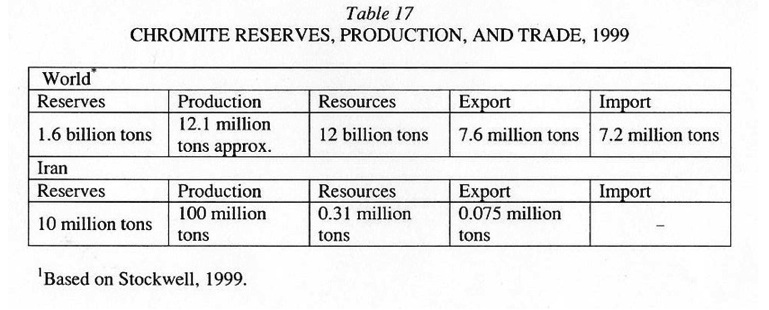
Chromium (Chromite). The known chromite ore deposits of Iran are of Alpine type and therefore hard to estimate their reserves. However, considering the number of chromite ore deposits and indications (almost 200), and the vast distribution of rock types that are associated with chromite, the possibility of discovering small- and medium-sized reserves (or even large-sized bodies, on the basis of geological characteristics) cannot be ruled out. Most of the chromite deposits of Iran are situated in Fāryāb, Esfandaqa, Makrān, the Ḵāš-Nehbandān belt, Sabzevār, and Neyriz (Fārs). The important chromite deposits of Iran are listed in Table 16, and the status of Iran’s deposits as compared to the world, in Table 17.
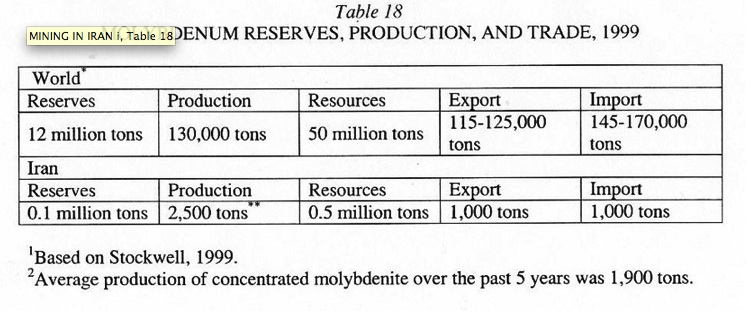
Molybdenum. There are considerable amounts of molybdenum associated with the porphyry copper deposits of Sarčašma, Meyduk, Songun, and Darra Zār. In addition, a number of vein type copper deposits of Iran show high contents of this metal, e.g., Senj copper deposit (Karaj). (See Table 18.)
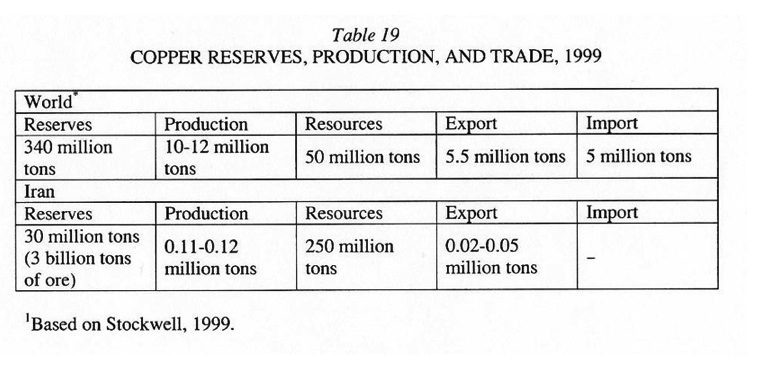
Copper. Around 500 ore deposits and indications of copper are recognized in Iran, while, only about 100 of them are surveyed and explored. Presently, there are 10 active copper mines in Iran whose reserves amount to 3 billion tons of ore, containing 30 million tons of copper metal comprising 9 percent of the world’s known copper reserves. The deposits can be geographically divided into 6 major provinces: Kerman (which holds the largest reserves of the country), Azerbaijan (predominantly situated in the Ahar Jolfā belt, in the Arasbārān area), southern Khorasan, northern Sistān (only reconnaissance surveys carried out), Mināb-Fahnuj (only reconnaissance surveys carried out), Sabzevār-Semnān (all are of vein type with no porphyry deposits yet reported), Ṭārom. (See Table 19.)
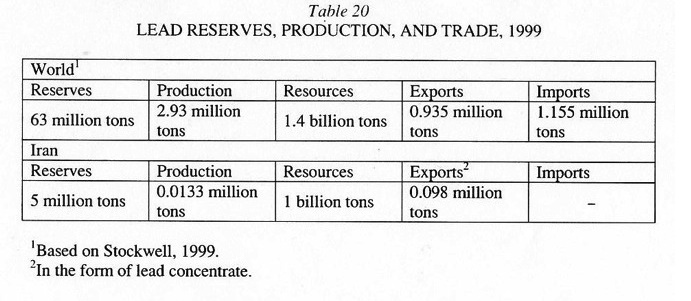
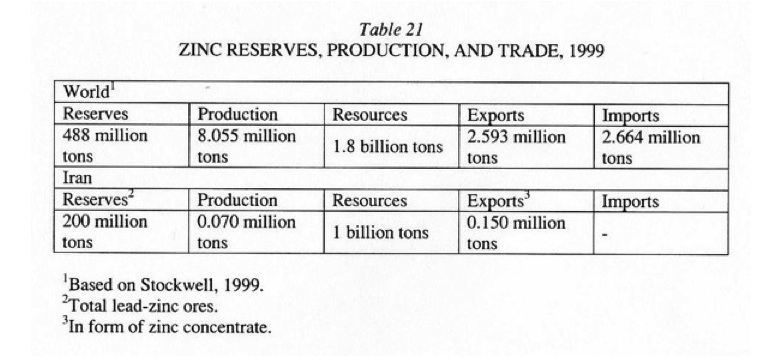
Lead-Zinc. The lead-zinc ore deposits and indications in Iran number more than 600. Taking into account the average grade of the ores, the amount of lead and zinc metals is estimated at 18 and 5 million tons, respectively. There is a high probability of finding new large reserves as the exploration techniques advance. (See Table 20, Table 21.)
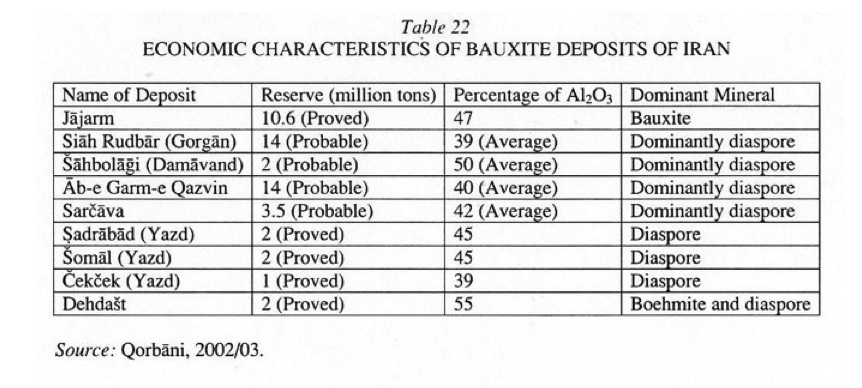
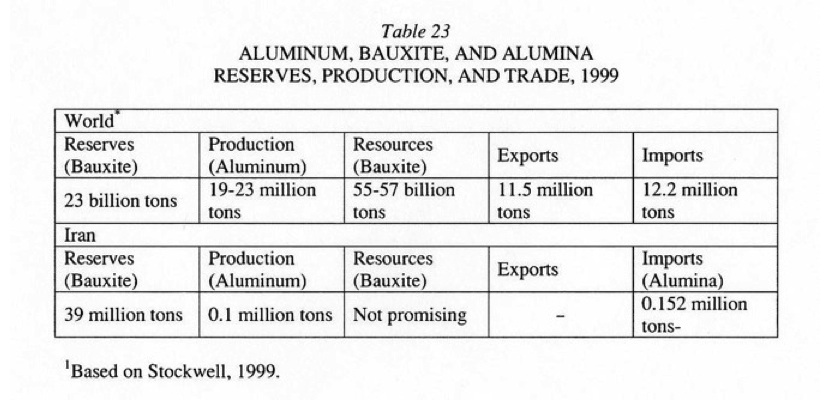
Aluminum (Bauxite). Bauxite reserves of Iran are not significant in amount, and considering the conditions required for the formation of this mineral as well as the geological setting of the country, discovery of extensive bauxite deposits is not anticipated. However, there are a few sizeable bauxite deposits that are economically exploited. These are listed in Table 22, while the status of the country from the point of view of aluminum resources is compared with that of the world in Table 23.
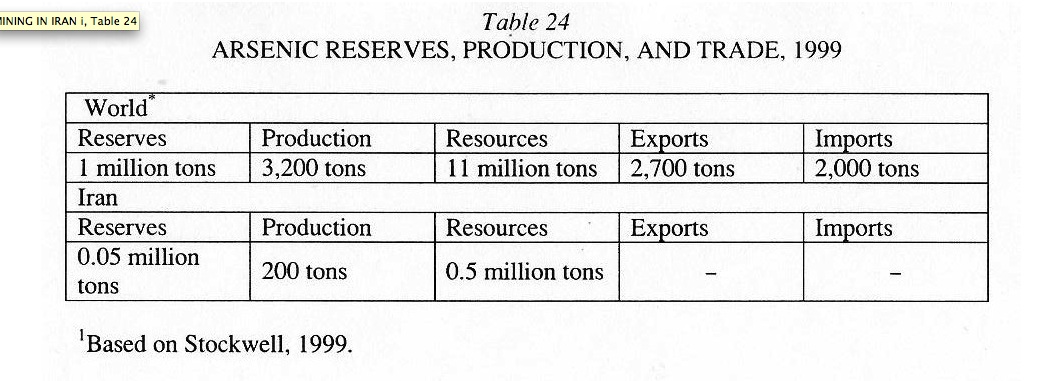
Arsenic. Although there are no estimates of the amount of arsenic reserves in Iran, the presence of 17 ore deposits and indications of this metal points towards vast occurrence of arsenic in Iran. Two ore bodies at Zaršurān and Walilu are exploited presently. The Zaršurān ore deposit is unrivaled all over the world for purity, texture and crystal form of its mineral (realgar). The most important arsenic ore deposits of Iran are Zaršurān, Čalpu (Kuh-e Sorḵ, Kāšmar), Daškasan, Walilu, Dastjerd, Tokma Dāš, ʿAliābād, Torbat-e Jām (arseno-pyrite), and Anārak (copper arsenate). (See Table 24.)
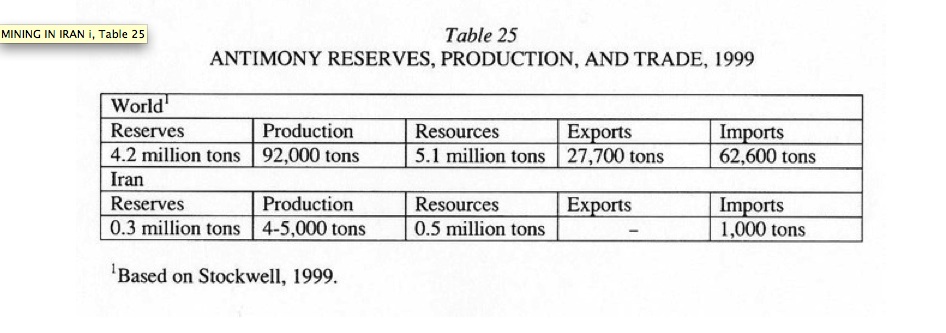
Antimony. Fifteen ore deposits and indications of antimony are known to occur in Iran, out of which only three are actively mined. The geographic distribution of antimony in Iran can be categorized into three regions: (1) Qorve, Bijār, Takāb (Daškasan, Moḡānlu and Āq Darra); (2) the Anārak area in central Iran (Patyār, Torkomāni); (3) the Ferdos, Kāšmar and Torbat-e Jām area in eastern Iran. (See Table 25.)
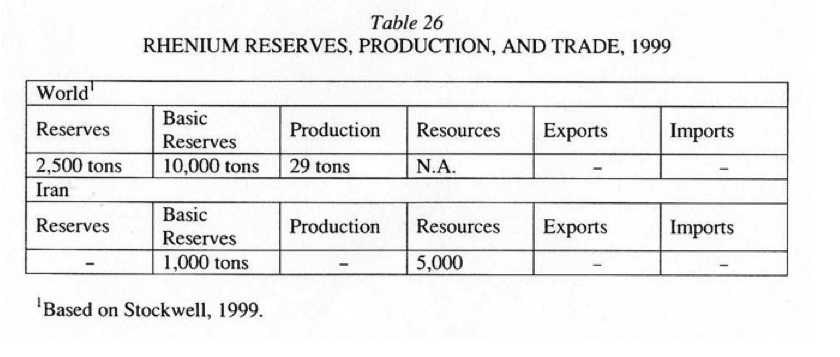
Rhenium. Some of the porphyry type copper deposits of Iran contain significant quantities of trace elements such as rhenium. (See Table 26.)
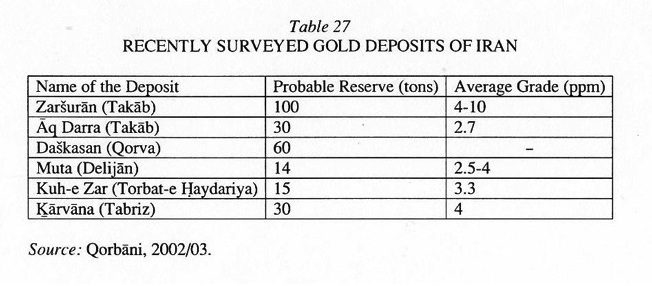
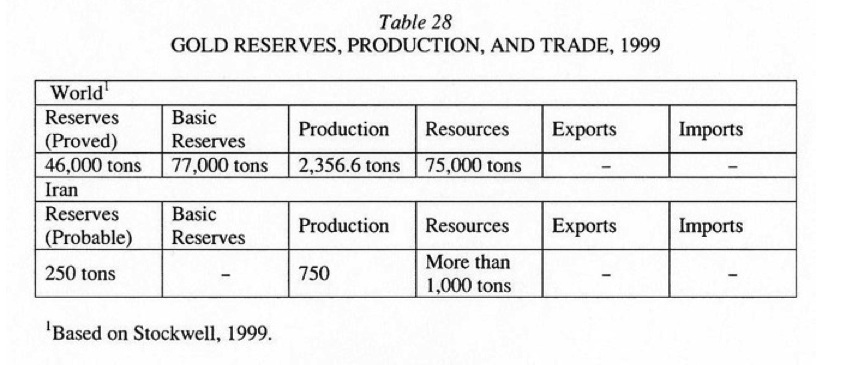
Gold. There are about 146 deposits and indications of gold in Iran, but no exact figure on the amount of reserves of this precious metal is at hand, due to unavailability of modern exploration techniques. Nonetheless, taking into account the geological evidence of gold mineralization, as well as the information on well-explored gold deposits of the country, the gold reserves of Iran are optimistically estimated at 1,000 tons. The specifications of the country’s major gold deposits are enumerated in Table 27, while the status of Iran among the gold-producing countries of the world is shown in Table 28.
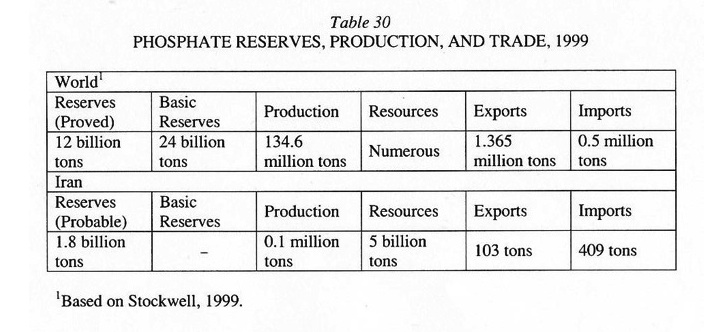
Phosphate. Over 80 phosphate occurrences and indications are known to exist in Iran. Based on the available exploration data, the proved reserves of the country can genetically be categorized into sedimentary and igneous types. Table 29 and Table 30 show the most important phosphate deposits and the global position of Iran, respectively.
Fluorite. Known fluorite resources of Iran number more than 30 with reserves estimated at 500,000 tons with base reserve of around 1 million tons. Presently, four localities are extracted. The most important fluorite reserves of Iran are situated in the following provinces: Māzandarān, with 83,000 tons; Khorasan, with 326,000 tons; Isfahan, with 120,000 tons; Kurdistan, with 5,000 tons.
Rock salt). Iran is famous for its numerous salt diapirs (salt domes), which are in fact mountains (made up of rock salt) that have pierced their overlying rock layers and become exposed at the surface. There are more than 100 such structures with very high salt content, each of which can be considered as an independent rock salt deposit. Additionally, there are many saltwater springs with high salt content that can be taken as a source of dissolved (aqueous) salt. In some lakes, such as Orumiya and Mahārlu, the salt content is so high that extraction by means of decantation method is possible. (See Table 31.)
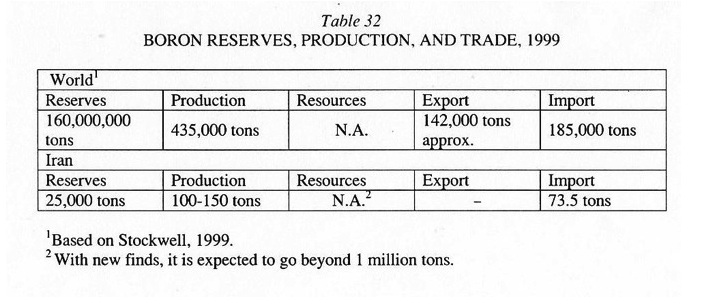
Boron (Borax). There are seven known deposits and indications of boron in Iran; but, taking into account the conditions favorable for formation of economic boron bodies, one can expect discovery of more such deposits in various parts of the country. (See Table 32.)
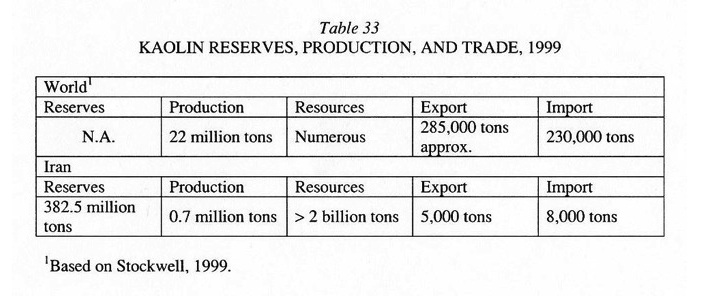
Kaolin. Over 70 deposits and indications of kaolin occur in Iran, most of which are suitable to be utilized in ceramic industry. (See Table 33.)
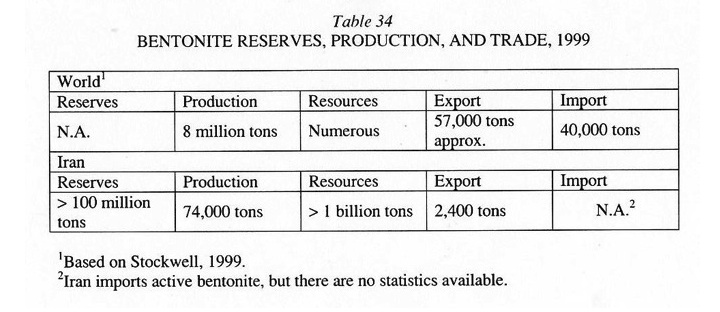
Bentonite. Ever since the ancient times, bentonite has been utilized in Iran, and at present there are more than 100 deposits and indications of it in various parts of Iran. (See Table 34.)
Vermiculite. The available information on vermiculite deposits of the country are incoherent and limited. Until today, there has not been any systematic exploration or survey carried out on the vermiculite deposits of Iran. There are numerous indications of vermiculite in Kerman, Šahin Dež (West Azerbaijan), Amlaš (Gilān), and Kaleybar (East Azerbaijan), with the last two being actively extracted.
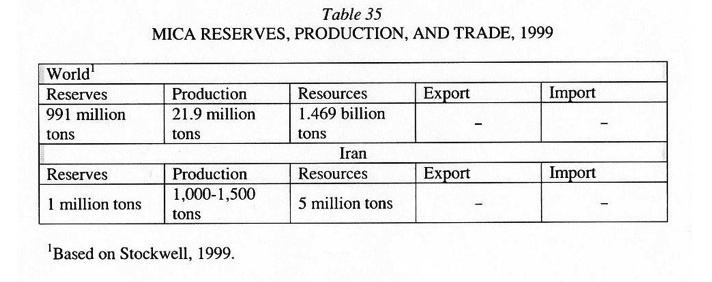
Mica. Various reserves and resources of mica are known to occur in Iran; there are over 40 deposits and indications of this mineral, amounting to overall reserves of more than 1 million tons. However, there are only two active mines where mica extraction is currently in progress—Māsula and Qarabāḡ.(See Table 35.)
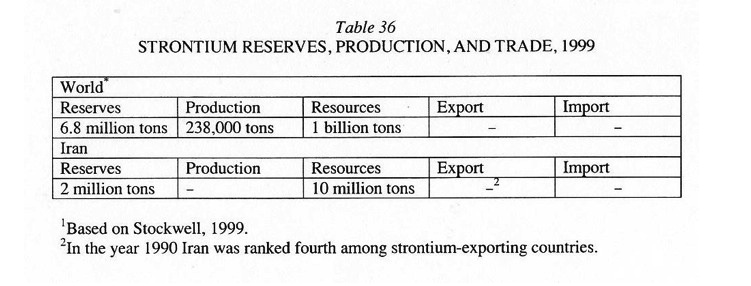
Strontium. Considerable reserves of celestite (strontium sulfate) are known, and 10 economic deposits are being extracted. These are distributed in southern Varāmin and Garmsār, Anārak, and northern Khuzistan. (See Table 36.)
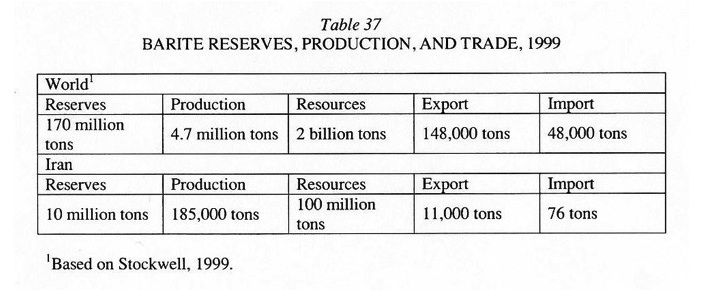
Barite. The number of barite deposits and indications in Iran exceeds 50, with overall reserves of 10 million tons. Nonetheless, there are high chances of discovering new reserves. (See Table 37.)
Diatomite. A number of diatomite deposits have been studied in Azerbaijan province, a few having considerable reserves. No data is, however, available on these deposits.
Feldspars. Half of the 100 known feldspar deposits and indications of Iran are currently being extracted. Genetically, these can be divided into two categories, namely, those associated with acidic intrusive bodies and those of volcanic and tufaceous origin.
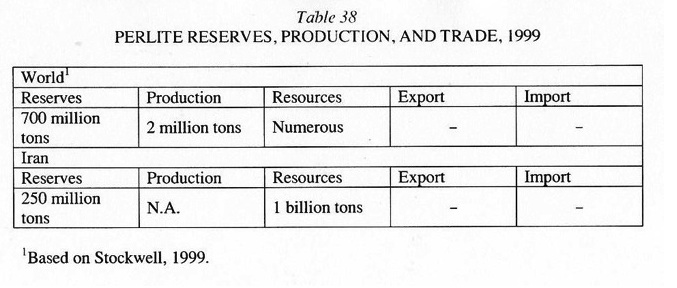
Perlite. The large reserves of perlite deposits of Iran are associated with shallow marine acid volcanic rocks. (See Table 38.)
Decorative and facing stone. Iran has very high potential for production and export of dimension stone (rock quarried to size and shape specifications); but, in spite of growing mine production during the past decade, in many instances this potential has been overlooked. Construction, decorative, and facing stones of Iran are among the highest-quality products in the world. In terms of variety of color, texture, quality, and economic value, some of these reserves are unique and can be extracted and exported, creating jobs and income for the country. In 1999, there were 1,584 active mines producing more than 66 million tons of dimension stone altogether; 567 of these mines produced about 7 million tons of decorative and facing stones. (See Table 39.)
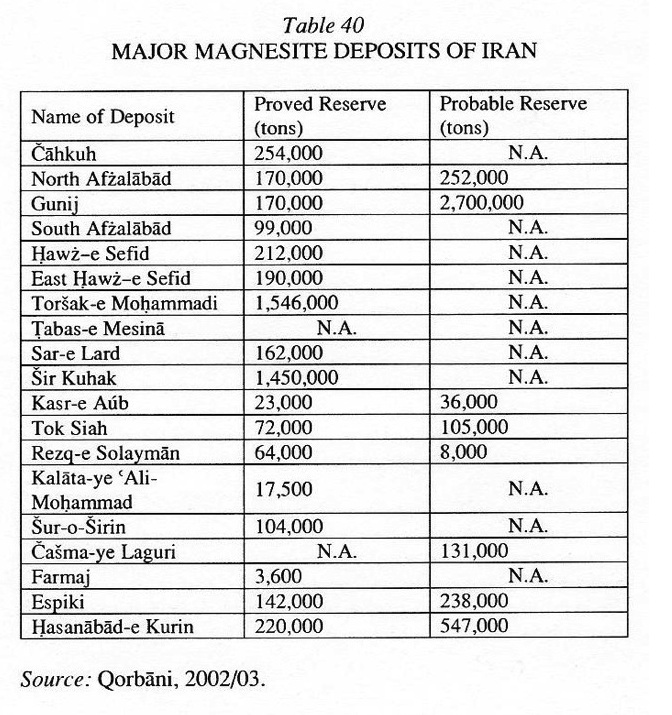
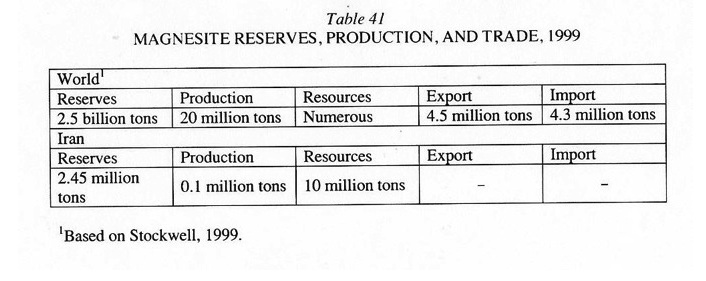
Magnesite. Most of the 100 plus magnesite deposit of Iran occur in Khorasan Province around Birjand. Table 40 and Table 41 show the most important magnesite deposits and the global position of Iran, respectively.
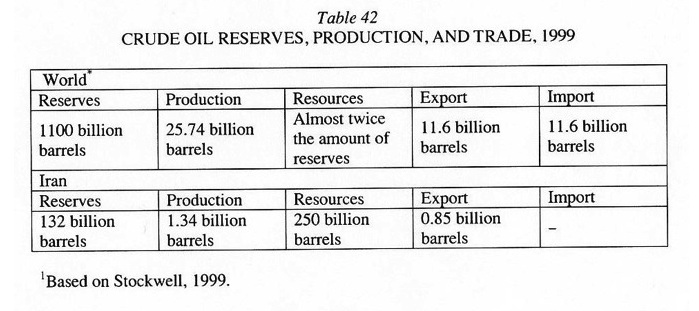
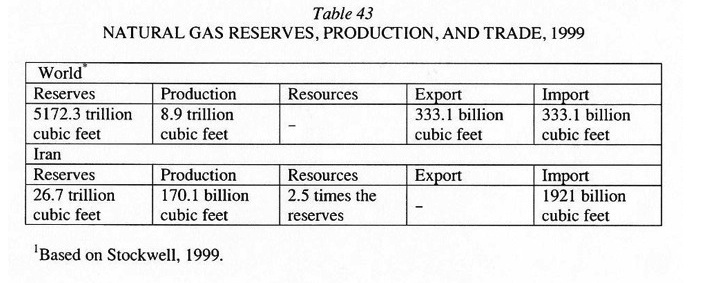
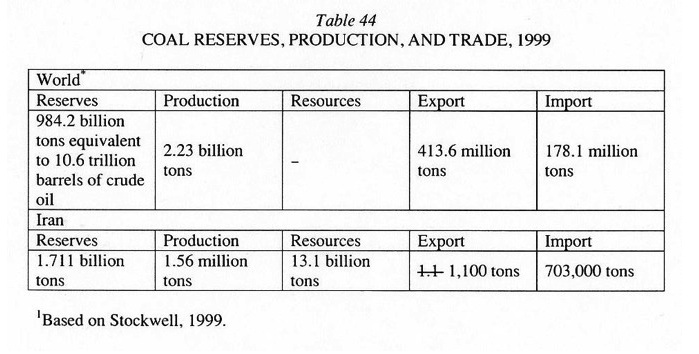
Fossil fuels (petroleum, natural gas, and coal). Coal reserves of Iran constitute a nominal 1 percent of the world reserves; but the country has around 11 percent of the total petroleum resources and 16 percent of the gas reserves and remains a potential target for further exploration activities, with many reserves still to be found. Thus Iran has a distinctive position from the point of view of fossil fuels. (See Table 42, Table 43, and Table 44.)
Water resources (budget). The annual precipitation in Iran amounts to 412 billion cubic meters of water, which is described in the form of the water budget of the country given in Table 45.
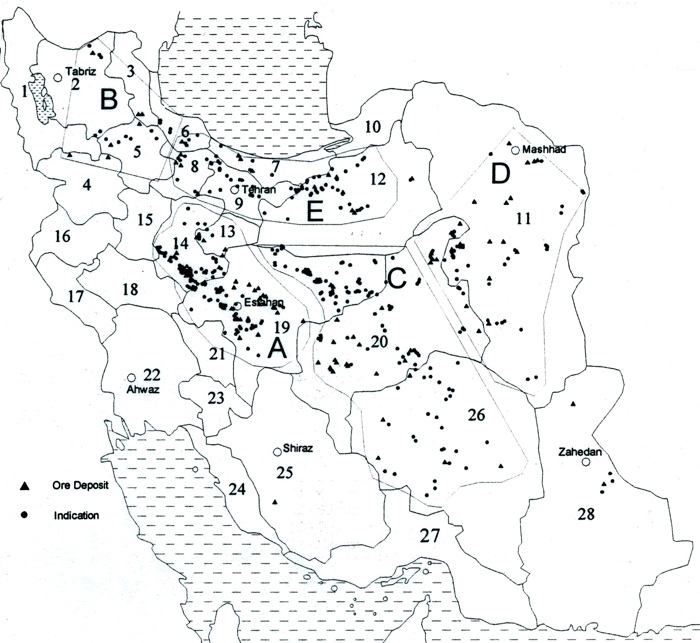
Figure 1. Distribution of Mineral Resources in Iran.
Bibliography:
[Websites were accessed 16 December 2004.] K. ʿAlipur, Tāriḵ-e dāneš-e zaminšenāsi wa maʿdan dar Irān, Geological Survey of Iran, Tehran, 1993-94.
Āryānzamin, Atlas of Mineral Deposits and Metallogeny of Iran, Tehran, forthcoming.
Central Bank of the Islamic Republic of Iran, “Economic Report and Balance Sheet,” “Economic Trends and Indices,” and “Annual Review of the Economy of Iran” for various years, available on the internet at http://www.cbi.ir/publications/. S. E. Kessler, Mineral Resources, Economics and the Environment, tr. Farid Mor, Aḥmad Hormozi, and ʿAbd-al-Majid Yaʿqubpur, Tehran, 1996-97.
Ministry of Mines and Metals [I.R. Iran], Annual Review of the Mining Sector, Tehran (various years). F. Mor, A. Hormozi, and A. Yaʿqubpur, Manābeʿ-e maʿdani az didgāh-e eqteṣādi wa zistmoḥiṭi (Mineral resources, economics and the environment), Tehran, 1996/97.
M. Qorbāni, Dibāčaʾi bar zaminšenāsi-ye eqteṣādi-ye Iran, Geological Survey of Iran, Tehran, 2002/03.
Idem, and F. Parvinpur, “Jāygāh-e maʿdani-ye Iran dar jahān,” in The 20th Symposium on Geosciences, Geological Survey of Iran, Tehran, 2001/02, pp. 39-40.
Statistical Center of Iran, “Statistical Report on Operative Mines of Iran,” 1383 AH solar [2004], available on the internet at http://www.sci.org.ir/.
L. E. Stockwell, World Mineral Statistics 1993-97: Production, Exports, Imports, Keyworth, UK, 1999.
USGS: United States Geological Survey, Minerals and Materials Information, United States Department of the Interior, Washington D.C., 2003 [CD-ROM]. M. Zāvoš, Kānišenāsi dar Irān-e qadim, rev. ed., 2 vols. in 1, Tehran, 1996/97.
(Mansur Qorbani and Anoshirvan Kani)
Originally Published: July 20, 2005
Last Updated: July 20, 2005