

iii. Population
Population of Gorgān will be described in two sections: (1) Population of the province, which has been formed recently under the name of Golestān Province with Gorgān City as its capital; and (2) population of Gorgān City and Gorgān Sub-province.
1. THE PROVINCE
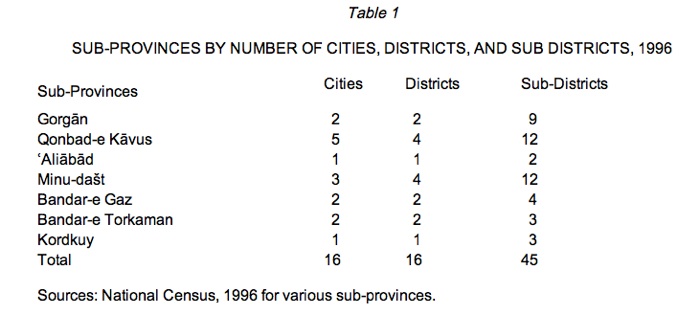
In June 1997 the eastern part of Māzandarān was delimited as the province of Golestān. This territory, which in the census of 1996 contained six Sub-province (šahrestān), covers an area of 20,300 km2 and is currently composed of 7 sub-provinces, 16 cities, and 16 districts (baḵš). There are also 999 inhabited villages in its 45 rural sub-districts (dehestān). It must be pointed out, however, that until 1986 the same boundaries contained two sub-provinces, the sub-province of Gorgān, and the sub-province of Gonbad-e Kāvus (formerly called Dašt-e Gorgān and Torkaman Ṣaḥrā). Gradually, several districts were redefined as sub-provinces and Gonbad was turned into two sub-provinces (Gonbad-e Kāvus and Minu-dašt) and Gorgān into five (Gorgān, Bandar-e Torkaman, ʿAliābād, Bandar-e Gaz, and Kordkuy). Table 1 shows the seven sub-provinces of the province by number of cities, districts, and sub districts.
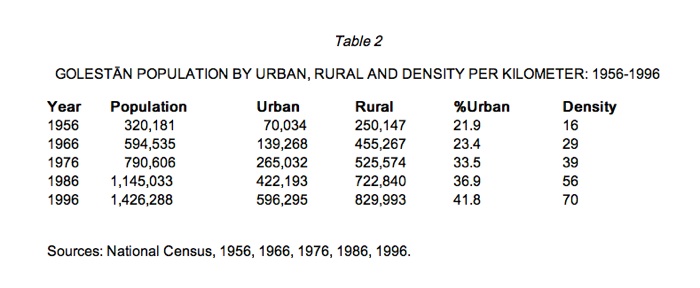
Over the past four decades, the population of Golestān Province as a whole has increased 4.5 times, 8.5 times in the urban and 3.3 times in the rural areas. In the same period, the number of its cities has increased from 5 to 16 (Table 2). According to the census of 1996, there were 1,074 inhabited villages in this province with an average population of 831 persons, which is significantly larger than the ones recorded in previous censuses. The sub-province of Gorgān with a population of 422,000 and the sub-province of Gonbad-e Kāvus with a population of 421,000 were the most populated sub-provinces.
The average rate of growth of the population of this province for the 40-year period of 1956-96 was close to 3.81 percent, 5.50 percent in the urban and 3.04 in the rural areas. For the decade 1986-96, these figures declined to 2.26 percent, 1.99 percent and 2.45 percent respectively, which show that, in this province, the rate of growth of the rural population exceeds that of the urban population. Among the sub-provinces, for the decade 1986-96, ʿAliābād with 4.53 percent had the highest rate of growth and Bandar-e Gaz with 0.9 percent the lowest.
Age structure. In 1996, 42.3 percent of the population of this province (39.7 percent in its urban areas and 44.3 percent in its rural areas) was under 15 years old, which compared to the average figure of 39.5 percent for the country as a whole, shows that this province’s population has a younger structure. This is confirmed by the fact that ratio of its population of over 65 years of age did not exceed 4 percent, compared to 4.3 percent for the country as a whole. By the same token, 60.1 percent of the population is in the active age group.
Religion and language. According to the 1375 Š./1996 census, 99.8 percent of the population of this province are Muslims and the religious minorities constitute a very small portion of the population: 294 persons were Zoroastrian, 159 Christian, 5 Jewish, and 1,209 persons adherents to other faiths. In the same year, 721 persons did not declare their religion. Nearly 77 percent of the Zoroastrians lived in the rural areas and, by contrast, 55 percent of the Christians lived in the urban areas.
A considerable percentage of the population of this province is composed of Turkmans, but there are no reliable statistics for their number, nor their distribution in various sub-provinces. In 1992, a birth statistical survey based on random sampling showed that 0.6 percent of the birth certificates issued in Persia were to babies whose mother tongue was Turkish (Zanjāni, 1992, pp. 49-57); another statistical survey based on a sample of 22,549 persons, showed that 421 persons, or 2 percent of the sample, spoke Turkish (Markaz-e Āmār-e Irān, 1993, p. 17). The Turkmans are composed of two main tribes of Yomut and Guklān. The Yomuts are divided into two groups of Čārvā and Čamur and 12 clans who live in ālāčiqs (felt-covered tents). Their territory extends from Gorgān to the north and east. The Guklāns’ territory is centered on Gonbad-e Kāvus and extends to the Atrak River, the mountains of Bojnurd, and the sand dunes of Turkmenistan to the north and the Yomut Desert to the west. The Guklāns have a similar tribal structure to the Yomuts. There are two groups of Ḥalqa-ye Dānmolu and Dudurqa, each composed of six clans. The Turkman have preserved their tribal structure to the present day.
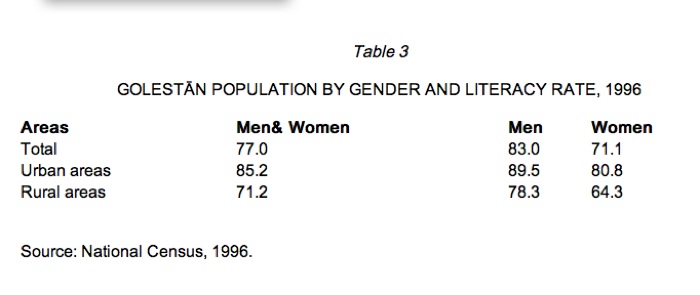
Education and literacy. Table 3 gives the literacy figures for the over six-year old population of Golestān province in 1996.
It is worth mentioning that 48.6 percent (49.4 in the urban areas and 48 percent in the rural areas) of the literate persons are composed of students.
Household size. In 1996, the average size of the household in this province was 5.3 persons (5.03 for the urban areas and 5.5 for the rural areas), which was higher than the average for the country as a whole (4.77 persons, with 4.56 and 5.14 for the urban and rural areas respectively). The highest figure of 5.6 persons for the urban areas and 6.2 persons for the rural areas belonged to the sub-province of Turkman and the lowest figure of 4.6 and 4.8 persons to the sub-province of Kordkuy.
Marriage. In 1996, 50.8 percent of this province’s population in the age group of 10-year old and over (51.7 percent for the urban areas and 50.1 percent for the rural areas) were married. This ratio was 51 percent for men (51.5 percent in the urban areas and 50.5 percent in the rural areas) and 0.6 percent for women (51.9 percent in the urban areas and 49.7 in the rural areas). This shows that, contrary to the past, marriage is less common in the rural areas. In the age group of 10-year old and over, 6.07 percent of women (6.0 percent for the urban areas and 6.1 percent for the rural areas) were either divorced or widows, the widows accounting for the great majority (94.7 percent).
The incidence of marriage in the literate population has been much less common than in the illiterate population and, for example, in 1996, only 38.6 percent of literate women of 10-year old and over were married, as compared to the figure of 75.9 percent for illiterate women. The same ratios were 42.7 percent and 86.5 percent for men. On may conclude that, in this society, literacy plays a determinant role in marriage and, as a result, in fertility and population growth.
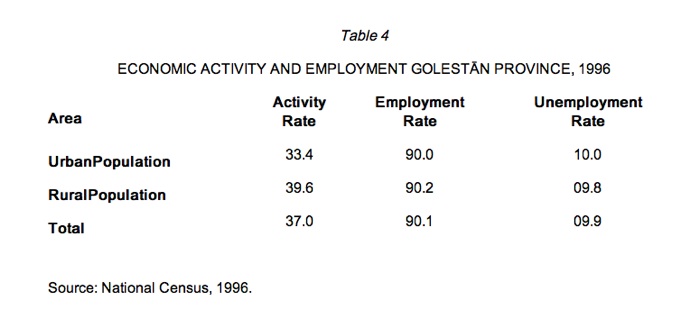
Economic activity. The latest activity and employment statistics for the 10-year old and over population of this province is given in Table 4.
Women constituted 17.6 percent of the active population, which was higher than the average for the country (12.7 percent). The distribution of employment according to activity shows that rural activity is predominant in this province, with agriculture accounting for 46.2 percent of employment, compared to 23.0 percent for the whole country.
GORGĀN CITY AND ITS SUB-PROVINCE
The city of Gorgān is the provincial capital of the newly created province of Golestān as well as the administrative center of the sub-province of Gorgān. In 1996, the province was composed of 2 cities, 9 districts, and 174 settlements, while the sub-province was comprised of two districts (baḵš) of Āq Qalʿa (former Pahlavi Dež) and Markazi.
Population. There are no reliable data on the population of the city of Gorgān prior to the first national census of 1956. Table 5 indicates the main features of the population of Gorgān based on the national censuses:
Table 5 shows that the population of the city has increased 6.65 times over a period of 40 years, with an average annual rate of growth of 4.85 percent. The recent fall in the rate of growth of the population has been due partly to the population policy of the government and partly to the return of the war veterans to their home towns. It may also, to some extent, have been due to the creation of new cities in the region, which have absorbed rural immigrants, indirectly reducing migration to Gorgān.
The structure of the population is relatively young and the age group of 0-14-year-old composed 37.1 percent of the population of Gorgān in the census of 1996, which is the lowest ratio in comparison to all the previous censuses. This reduction, from 43.6 percent in 1986, is an indication of the success of the population control policy of the government.
Economic activity. The activity rate of the above-10-year old population of Gorgān has fluctuated considerably during the past 30 years, falling from 44.4 percent in 1966 to 37.6, 41.1, and 34.3 in the next three decades. This is partly because of the limited scope and the small share of agricultural sector in employment (6.64 percent in 1976 and 6.77 percent in 1996), and partly due to the entry into the labor market of the children born after the Revolution of 1978-79, when the former birth control policies were abandoned and, in fact, reversed. Economic bottlenecks created by the war and employment policies also aggravated the situation. Meanwhile, as a result of the sectoral structure and increased government domination of the system of production and business, coupled with the confiscation of workshops, farms, and factories, the proportion of public service employees reached the figure of 43.6 percent in 1986, compared to 35.5 percent in 1976. In the same period, the percentage of private sector employees fell from 39.7 to 31.1 and that of the self-employed increased from 18.4 to 29.8 (National Census, 1956, 1966, 1976, 1986, 1996).
Housing and housing facilities. In 1996, 99.9 percent of the families of Gorgān lived in ordinary housing units and the number of makeshift dwellings or sheds did not exceed 15 units. Among them, 66 percent owned their dwellings, while 24 percent were tenants and 9 per-cent lived in free or subsidized housing units. In 1976, 54 percent were owners and 37 percent tenants. In the meantime, like elsewhere, the quality of housing was improved in the years following the Revolution: the percentage of one-room and two-room dwellings fell from 8 percent and 19 percent in 1976 to 4 percent and 14 percent in 1986 respectively. In 1996, 99 percent of the families had electricity, 99 percent used pipeline water supply, 36 percent had telephones, and 36 percent were connected to gas pipe-line. Gas was used by 98 percent of the families for cooking and by 73 percent for heating.
According to the latest master plan prepared by the consultant engineers (Mohandesin-e mošāwer, 1974, p.1), more than 90 percent of Gorgān’s housing units consisted of independent dwellings, 9 percent consisted of collective units of 2 to 3 dwellings and 1 percent consisted of apartment complexes.
Education and literacy. According to the last national census of 1996, 89 percent (92 percent of men and 86 percent of women) of the population of Gorgān in the age group of over 6-year-old were literate. Students composed nearly one-third of the population, of which 4,291 followed advanced courses, and the number of girls was constantly growing. The level of education and literacy has been rising in Gorgān as well as all over Persia after the revolution.
Marriage. In 1996, 67 percent of the men over 15 years of age were married, 31 percent had never married, and 1.4 percent were widowers and divorced; of the women over 10-year-old, the same ratios were 54 percent, 39 percent, and 6 percent respectively. The average age of the first marriage in the rural district of Gorgān (including the cities of Āq Qalʿa and Gorgān) was 26 for men and 23 for women. For men, the average age of first marriage has little fluctuated in the past, while for women, the average age of first marriage has risen by about 3.5 years during the past 40 years.
Physical characteristics. In addition to its role as an important administrative and political center in the northeast of Persia, the city of Gorgān is a hub of agriculture (especially, wheat, cotton, and oil seeds), agro-industrial activities, and technical services. The city has gone through a period of rapid physical development. Its first pilot project was prepared in 1966 and its first master plan was approved in 1974. Its second master plan was prepared in 1994, whose implementation still continues. The area of the city has increased 160 percent in a period of 20 years, from approximately 1,000 hectares in 1973, to 1,522 hectares in 1986 and 2,600 hectares in 1992 (Mohandesin-e mošāwer, 1974a, p.1).
The fabric of the city is in three parts: (1) The old fabric, composed of about 5 percent of its area; (2) the new development, mostly constructed after 1961 around the old fabric, in the form of new quarters; and (3) the periphery, composed of more than 70 haphazard satellite-towns, collectivities and quarters, mostly constructed after the revolution. The consultant engineers and the architects responsible for preparing the new master plan for the development of the city of Gorgān in the years 1994-2006, have enumerated its aims as follows: (1) to harmonize and create a rational relationship between the physical sectors and control the city’s haphazard expansion brought about by the uncontrolled development of unevenly dispersed satellite-towns; (2) to find solutions to the problems of uncoordinated distribution of space, service facilities, and infrastructures in the city and its suburbs; (3) to submit a plan for the disposal of waste surface water and its purification, which, given the city’s topography and considerable rainfall, is of utmost importance; (4) to submit a proposal for an efficient transport system, which, as a result of uncoordinated urban development, has become quite inadequate; and (5) to draft rules and criteria for construction of residential, commercial and industrial units (Mohandesin-e mošāwer , 1974b, p. 47).
According to the consultant engineers (Mohandesin-e mošāwer), the physical development of the city was built around Maḥalla-ye Meydān, the oldest quarter; later development covered the northeast triangle creating the Naʿlbandān and Sabza Mašhad quarters. Further expansion took place in the east and northeast, while mountains and forests in the south and city moat in the west halted southward and westward expansions.
Bibliography:
Markaz-e āmār-e Irān, Natāyej-e āmār-giri az ḵoṣuṣiyāt-e ejtemāʿi-eqteṣādi-e ḵānavār XII, Tehran, 1372 Š./1993.
Mohandesin-e mošāwer-e ṭarḥ o meʿmāri, “Ṭarḥ-e jāmeʿ-e Gorgān, fāz-e yekom,” Tehran, 1373 Š./1994a.
Idem, “Ṭarḥ-e jāmeʿ-e Gorgān, fāz-e dovvom,” Tehran, 1373 Š./1994b.
Idem, “Ṭarh-e jāmeʿ-e šahrestān-e Gonbad-e Kāvus fāz-e yekom,” Tehran, 1375 Š./1996.
Manṣur Gorgāni, Eqteṣād-e Gorgān o Gonbad o Dašt, Tehran, 1350 Š./1971.
Sāzmān-e barnāma wa budja, Āmār-nāma-ye ostān-e Golestān, Tehran, 1377 Š./1898.
Ḥabib-Allāh Zanjāni, Rāhnemā-ye jamʿiyat-e šahrhā-ye Irān, 1335-1370, Tehran, 1368 Š./1989.
Idem, Jamʿiyat wa šahr-nešini dar Irān, Tehran, 1370 Š./1991.
(Ḥabib-Allāh Zanjāni)
Originally Published: December 15, 2002
Last Updated: February 17, 2012
This article is available in print.
Vol. XI, Fasc. 2, pp. 145-148
Ḥabib-Allāh Zanjāni, “GORGĀN iii. Population,” Encyclopaedia Iranica, XI/2, pp. 145-148, available online at http://www.iranicaonline.org/articles/gorgan-iii (accessed on 30 December 2012).