

- GĪLĀN
- ii. POPULATION
There are no reliable sources on the population of Gīlān until the first national census of population and housing in 1956. Reflecting on various population estimates or plausible guesses for the provinces of Gīlān and Māzandarān in the 19th century, George Curzon writes, “The population of two provinces suffered terribly from the plague of 1830-31, in which it was estimated that two-thirds were swept away. Epidemics of small-pox and other diseases have ravaged the district since, and it is only latterly that it has begun again to hold up its head. The total for two provinces are variously estimated at from 150,000 to 250,000; but I doubt if the data for correct enumeration have ever been collected” (Curzon, Persian Question I, p. 364). H. L. Rabino di Borgomale, who surveyed Gīlān from 1906-12, estimated the population of the province at about 340,000 (Rabino, p. 59).
Total population 1956-96. The first general census was carried out in 1956 and the sixth in 1996. The geographical boundaries and area of this province have varied from one census to another; at the present time it has an area of 14,819 square kilometers and includes 99 districts, 30 counties and 12 townships. In 1996, there were 2,700 settlements and 35 cities in Gīlān. On the basis of its present boundaries and area, Table 1 indicates the population of Gīlān from 1956 to 1996.
It is clear that the rate of growth of the population of Gīlān has consistently remained below that of the country as a whole, and its average of 1.59 percent for the period of forty years falls 0.86 percent below the average for Persia as a whole; however, the censuses of 1991 and 1996 apparently contain an under-estimation. This is born out by the comparison of growth rates for each period as shown in Table 2.
On the other hand, the density of population (number of inhabitants per square kilometers) in Gīlān has always been higher than the average for the country as a whole, ranging from 69.9 against 11.5 (more than six times) in 1956, to 151.3 against 36.4 (4.2 times) in 1996.
Urban population. In 1996, the urban population of Gīlān accounted for slightly more than 46.8 percent of its total population. Of its 35 cities, the city of Rašt, with a population of 418,000, was the most populated, and the city of Māsūla, with a population of 663, the least. The ratio of urbanization in Gīlān has varied from 21.0 percent in 1956 to 23.5 percent in 1966, 29.2 percent in 1976, 37.7 percent in 1986 and 46.8 percent in 1996. This ratio has always been lower for Gīlān than the average for the country. Rašt is the only city with more than 100,000 inhabitants but, compared to the medium and small sized cities, its share of the urban population has fallen considerably. From 1956 to 1996 its share of the urban population dropped from 50.2 percent to 39.8 percent.
Rural settlements. In the meantime, temperate climate, moderately good roads and relative availability of public services in this region favor life in the countryside, and there are some 2,700 rural settlements in Gīlān, accounting for about 53 percent of its population. The average village population in Gīlān has always been higher than the country as a whole. In 1996, the figure for Gīlān was 441 persons, compared to the average of 338 persons for the country as a whole. On average there is a settlement for every 5.5 km2 in Gīlān; the comparable figure for the country as a whole is 24.2 km2.
Age and gender structure. Currently, about 34.5 percent of the population of Gīlān is under 15, 59.8 percent between 15 and 64, and 5.7 percent is 65 years old and over. A comparison of the ratio of the population under 15 in different censuses (for example, 47.1 percent in 1966) shows that the population is getting older and its age structure is becoming more balanced.
The gender structure of the population in Gīlān has also always been relatively well-balanced as the range of the male/female ratio fluctuated between 102.5 and 104.3 female in proportion to 100 male in the period from 1956-91. In 1996 census, the ratio of the province is reported 99 female as opposed to 100 male which. considering the migration trends and the above figures reported in previous censuses, seems to be implausible. In 1996, 56.3 percent of the male and 61 percent of the female population ten years of age and over were reported married, which shows a slight decline in the last twenty years.
Mortality and birthrate. General mortality rate in the years 1991-96 was estimated at 7 per thousand of the population (5.6 in urban and 7.5 in rural areas) with life expectancy at birth of approximately 64.2 (67.2 for urban population and 61.7 for rural population). Recent census reports on birthrate are less accurate than those on morality rate due to under-enumeration of the age group of 0-1 year as well as 1-4 years, which is the main indicator for estimating birthrate. The latest available data for 1986 estimates general birthrate of 31.4 births per thousand of population for urban areas and 34.8 per thousand in rural areas. These figures may have decreased to 25 births per thousand of population in urban and 30 births per thousand of population in rural areas.
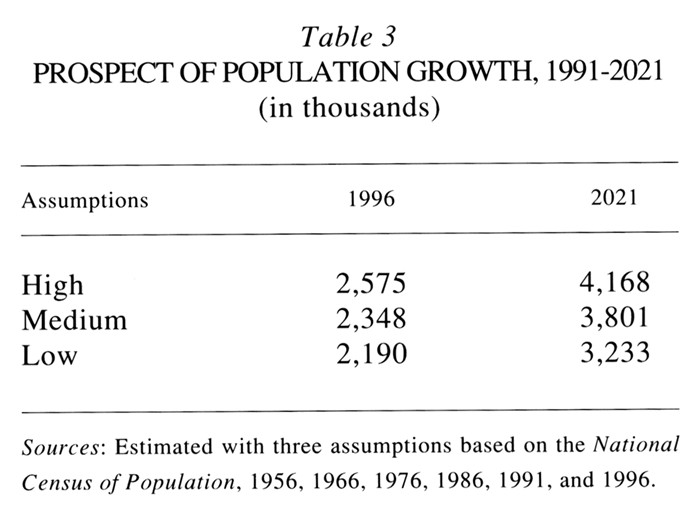
Prospect of population growth. The potential growth of Gīlān’s population is estimated according to three assumptions for the thirty-year period from 1991-2021 as shown in Table 3.
Under the high assumption, for the thirty-year period from 1991-2021, the average annual rate of growth of the urban and rural populations in Gīlān will reach to about 2.96 percent and 1.16 percent, respectively. Under the second and third assumptions, these rates are lower. It seems, however, that the second assumption is more realistic and most probably the rate of growth of the urban population will be closer to 2.5 percent and that of the rural population just under 1 percent .
Bibliography:
H. L. Rabino, Les provinces caspiennes de la Perse: Le Guîlân, RMM 32 (1915-16), Paris, 1917.
H. Zanjani, Moṭālaʿāt-e jamʿīyat-e ṭarḥ-e kālbodī-e mellī, 35 vols., Tehran, 1371-1373 Š./1992-94.
Idem, Jamʿīyat wa šahr-nešīnī dar Īrān I: Jamʿīyat, 2nd ed., Tehran., 1371 Š./1992.
Addendum (5 June 2012)
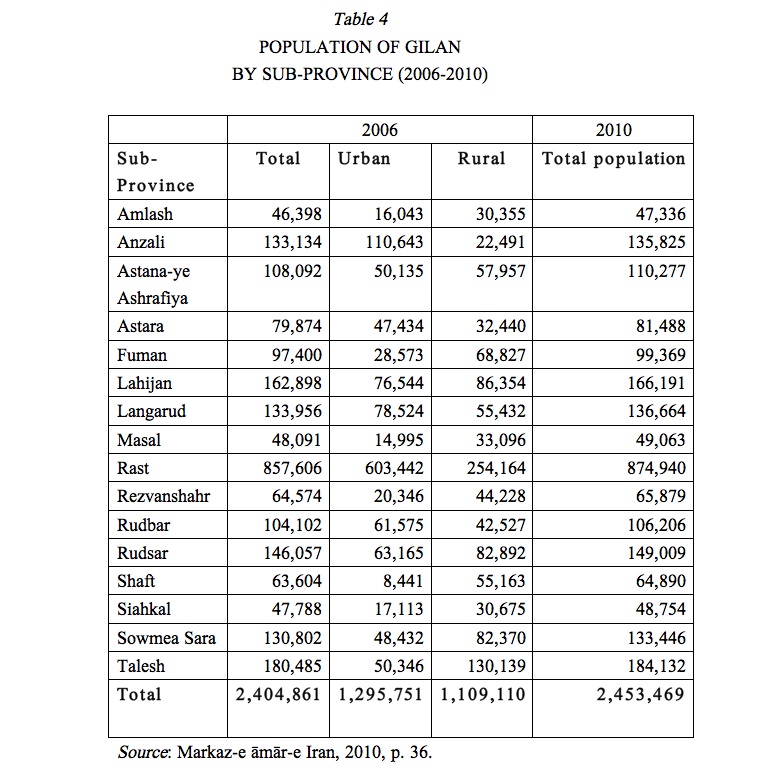
Boundaries and population. The boundaries of the Province of Gilan and the number of sub-provinces have remained the same as before, from the 1996 census to the population estimate made by the Statistical Center of Iran for the year 2010 (Markaz-e āmār-e Iran, 2010, p. 36). In the decade after the 1996 census, the population of Gilan increased only slightly, from 2.2 to 2.4 million, due to a sharp decline in fertility rate (see below). Table 4 shows the urban and rural population of the Gilan sub-provinces, according to the census of 2006 and the 2010 estimation.
The number of cities increased from 35 in 1996 to 49 in 2006, when Gilan comprised 43 districts (baḵš), 109 sub-districts (dehestān), and 2,935 villages. By the end of 2006, the number of populated villages had decreased to 2,686, since eight of them had turned into cities and 241 had been deserted (Sāl-nāma-ye āmāri-e sāl-e 1386 Ostān-e Gilān, Chap. I).
Fertility and mortality. The general fertility rate (the number of live births in 2006 per 1,000 women of reproductive age, generally 15-49) and the crude birth rate (the number of children born in 2006 per thousand population) were calculated from the data of the 2006 census for urban and rural areas. In view of the subsequent great decrease in the fertility rate throughout Iran, the future rate of population growth in Gilan province can be expected to be much lower than the value predicted previously (see above, Table 3). Based on the concordant prediction of the total population of the country and those of the provinces in the study by Zanjāni et al. in 2009 (p. 34), the general fertility rate in this province in 2006 was calculated at 1.44 (1.60 in urban area and 1.25 in rural area; ibid., Table 15, p. 35), and the crude birth rate as 13.8 for the entire province, 15.7 for urban areas, and 11.5 for rural areas (ibid., Table 15, p. 35). In this study, life expectancy of children born in 2006 was predicted at 74.2 years for girls and 71.2 years for boys (77.0 and 74.6 in urban areas, 72.6 and 70.5 in rural areas (ibid., Table 19, p. 42). The mortality rate in 2006 was calculated 6.19 per thousand for the total province (5.56 in urban areas, and 6.91 in rural areas (ibid., Table 18, p. 42).
Migration. The net migration during the ten-year period from 1996 to 2006 was 24,679 persons, as 177,707 residents emigrated from Gilān to other provinces, while 202,386 persons immigrated from other provinces to live in Gilan (ibid., Table 26, p. 61, based on the data concerning Gilan provided by the 2006 census).
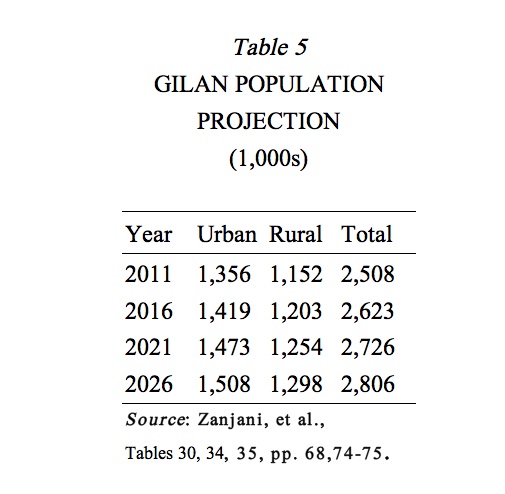
Population projection. It was also predicted by Zanjani et al., in 2009 that the fertility rate in Gilan until 2026 would be 1.492 in the cities and 1.592 in the rural areas, and life expectancy would increase in the urban areas to 76.03 years for males and 79.05 years for females, and in the rural areas to 71.93 years for males and 75.16 years for females. It was also predicted that migration within the province itself would also increase from 16,653 people (9,954 men and 699 women) during 2006-2011 to 19,044 persons in the five-year period of 2021-26 (Table 5).
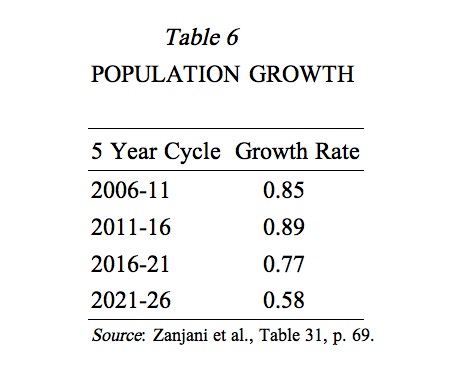
Based on the estimates presented in Table 2, the annual growth rate of Gilan population in each cycle of five years from 2006 to 2026 is predicted to sharply decrease from 0.85 percent in the period 2006-2011 to 0.58 percent in the period 2021-2026 (Table 6).
Bibliography:
National Census of Population for the total country and Gilan Province for 2006.
Markaz-e āmār-e Iran, Našriya-ye barāvard-e jamʿiyat-e Šahrestānhā-ye kešvar bar asās-e taṭbiq-e maḥduda-ye joqrāfiāʾi-e Ṣahrivar-e 1389, Tehran, 2010.
Idem, Sāl-nāma-ye āmāri-e sāl-e 1386 Ostān-e Gilan, Chap. I, “Sarzamin o āb o havā” (no page numbers).
H. Zanjani et al., Pišbini-e jamʿiyat-e kešvar va ostānhā, Tehran, 2009.
(Habibollah Zanjani)
Originally Published: December 15, 2001
Last Updated: June 5, 2012
This article is available in print.
Vol. X, Fasc. 6, pp. 625-626