

EMPLOYMENT, economic activity in which one engages and employs his or her time and energy. Before the first general census was carried out in 1956, there were no comprehensive data available on the active population in Persia on a national scale. Since 1956, the data provided by successive censuses (q.v.) and surveys make it possible to analyze the level of employment and economic activity. Whatever their inaccuracy in recording, interpretation or classification, these data provide a general idea of the situation and how it has evolved. In this article major aspects of employment will be discussed, including dependency ratio, activity rate, male/female employment gap, unemployment, urban/rural difference, sectoral changes of employment and economic activity in agriculture, industry and services, and employment in public/private sectors.
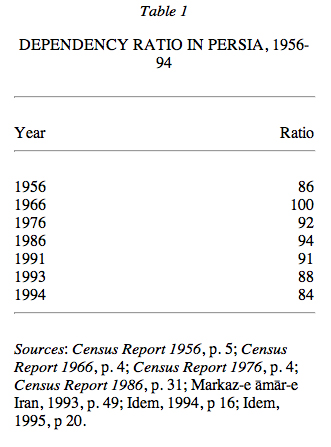
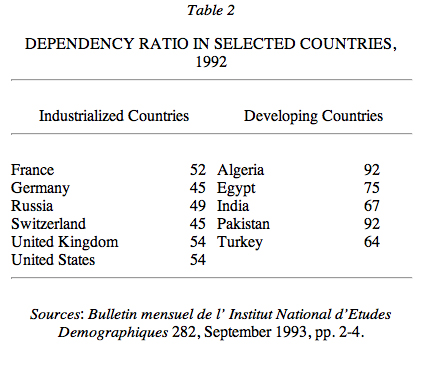
Dependency ratio. To illustrate the relationship between the active and inactive population (in a purely demographic sense) an index of the ratio of dependence may be constructed, that is, the ratio of the inactive population (under 15 and over 64) to the active population (15 to 65 year old group), in percentages. This index shows the impact and change of the age structure, especially those associated with fecondity, represented by the proportion of 0-14 year old group, upon the active population, i.e., the 15-65 year old group (Table 1 and Table 2 indicate the very high change of inactive population in Persia and other developing countries, compared to the industrialized countries).
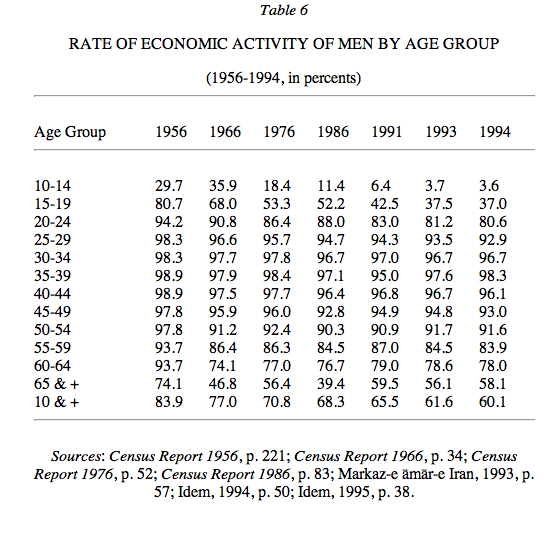
Activity rate. The high rate of activity of men in 1956, at the beginning and end of active life, namely, the two age groups of 15-19 (almost 81 percent) and 65 and over (74 percent), is worth noting. Even for the latter group, which goes beyond the retirement age, the rate of activity seems unsually high. This situation has remained more or less unchanged throughout these years. Before and after the Islamic Revolution more than half the population of 65 year-olds and over continued to work (or seek work, as “active” includes the employed as well as those seeking employment).
However, whereas the rate of activity of under 55 year old men in 1991 is below its level of 1976, the rate of activity of men of 55 and over is higher in 1991 than in 1976. In other words, after the Revolution older men (55 year old and over) have been compelled to work to earn a living, despite the handicaps and problems of age.
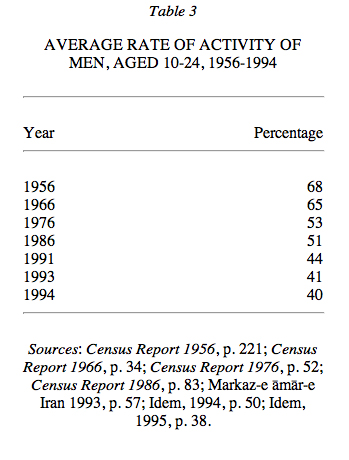
So far as the very young male population (10-24 year old) is concerned, generally the rate of economic activity has declined rapidly. For this age group the rate of economic activity has fallen from 68 percent in 1956 to 40 percent in 1994 (Table 3).
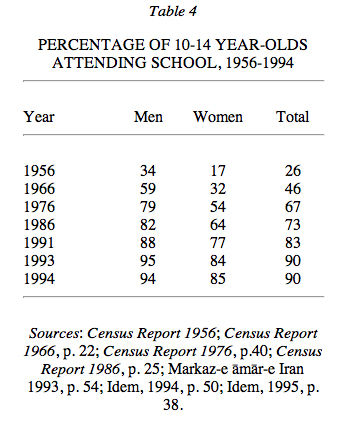
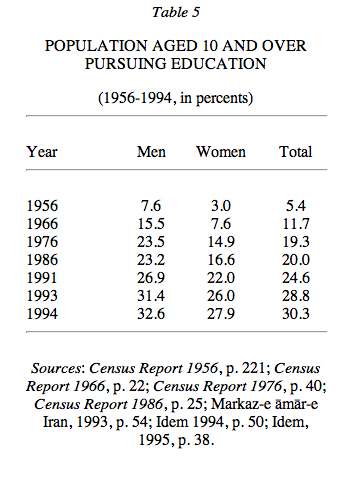
This decline is in large part due to the increase in schooling of this age group for men as well as for women. For instance, while in 1956 34 percent of boys and 17 percent of girls in the 10-14 year old group attended school, in 1994 the respective figures were 94 percent and 85 percent (Table 4).
Male/female gap. A striking aspect of the economic activity in Persia is the low share of female population. In 1956 it was 9.2 percent for the female population aged 10 years and over, nine times less than men.
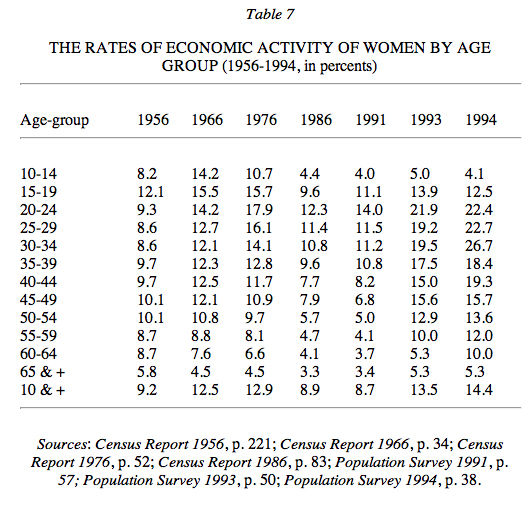
An almost classic pattern of the rate of female activity may be observed in 1956: the peak before fecondity and marriage, in the 15-19 year old group; a massive decline during fecondity, caused by the great number of children and related maternal obligations; and an upturn afterwards, at the end of the period of fecondity (about 50), when the children have all grown up. This is an almost perfectly bimodal distribution.
In 1966 (second census), the peak of female economic activity with a rate of 15.5 percent is still found in the 15-19 year old group, but the upturn appears near the end of fertile life.
The situation changed in 1976 and after the Revolution; the highest rate of activity of women moved to a higher age group, that is, the 20-24 years old; it was 17 percent in 1976, 12.3 percent in 1986 (the fall is considerable), 14 percent in 1991 and 21.9 percent in the survey of 1993. Finally, according to the survey of 1994, the peak activity of women has moved yet to a higher age group, reaching 26.7 percent for the 30-34 year-olds.
The rise in the age of the first marriage of women and, as a result, the change in their attitude toward maternity and its postponement, have played an important role in the rising age of peak activity and employment of women. Added to this is the effect of the increase in the percentage of women continuing their education, which in itself could change and push upwards the distribution of the rate of activity as well as the peak age of female economic activity beyond the 15-19 year old group, as illustrated in Table 5.
Altogether, the general rate of women’s economic activity has dropped sharply after reaching 12.9 percent in 1976, falling to 8.9 percent in 1986 and 8.7 percent in 1991. The surveys of 1993 and 1994, however, indicate a significant rise; according to these surveys the general rate of female activity has reached 13.5 percent in 1993 and 14.4 percent in 1994.
On the other hand, the general rate of men’s economic activity has continuously declined: 84 percent for the population of 10 years old and over in 1956, according to the sampling survey of 1994 this rate has dropped by 24 points in 38 years and fallen to 60 percent.
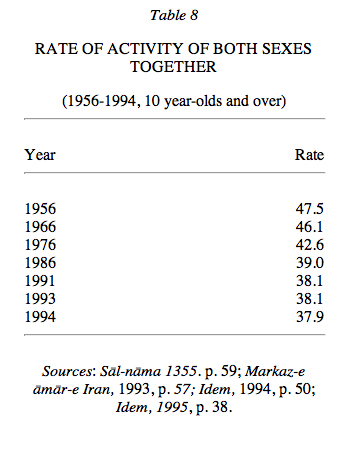
As was pointed out above, this decline has been mainly due to the increase in the number and the proportion of young people attending primary and secondary schools and, to a lesser extent, of those following higher education. Meanwhile, after the Revolution, unemployment among men has undoubtedly had an adverse effect on the rate of male economic activity. In 1986 the rate of unemployment for the active male population of 10 year olds and over was 9.2 percent, and reached 9.5 percent in 1991(for further comparison, the rates of economic activity of men and women for various age groups at the time the seven censuses and surveys were administered are given in detail in Tables TABLE 6, TABLE 7, and TABLE 8).
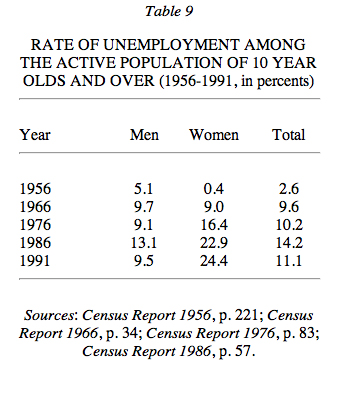
Unemployment. Given the fact that the rate of activity is the ratio of the active population to the population in age of activity, and bearing in mind that the active population itself is composed of the population employed and the population unemployed, it would be of interest to calculate the rate of unemployment among the active population, as illustrated in Table 9.
As can be seen, in contrast to men, whose rate of unemployment seems to have freely fluctuated, women have faced a constant upward trend, with a marked jump in 1966 with 9.0 percent, compared to 0.4 percent in 1956.
A certain awareness of Persian women in the 1960s of the importance and necessity of their role in the economy has probably led them to the labor market and to demand employment. From then on, they have taken part in economic activities and employment and, accordingly, their unemployment rate has continually increased.
The Islamic Revolution, especially in its early years, has not been favorable to the employment of women (12.9 percent active in 1976, 8.9 percent in 1986 and 8.7 percent in 1991), thus influencing female unemployment, which reached the unprecedented level of 22.9 percent in 1986 and 24.4 percent in 1991. It is noteworthy that according to the 1993 and 1994 surveys, women’s employment activity has increased in recent years and reached 13.5 percent and 14.4 percent, respectively.
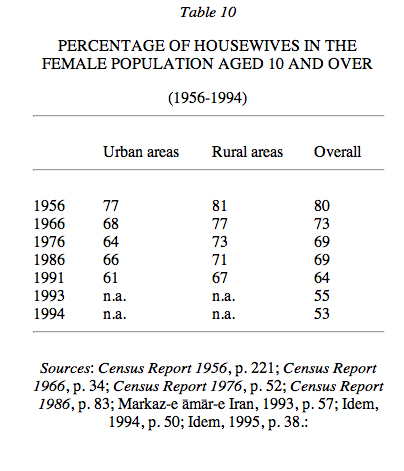
With regard to women’s unemployment, it is necessary to bear in mind that in these censuses and surveys persons pursuing their education, the retired and housewives are classified as economically inactive. These censuses and surveys, however, show that the proportion of housewives has continuously declined, and more noticeably so in urban areas (Table 10).
At the same time, the percentage of all women following their studies, as has already been pointed out, is growing, both since before and after the Revolution. Finally, the share of married women, especially at the beginning of the age of economic activity, is falling (Table 11).
These two factors—the decline in the rate of marriage (nuptiality) and the pursuit of education—are what push women toward the labor market. Because the labor market is incapable of absorbing this new female demand, the ensuing result is a rise in women’s unemployment.
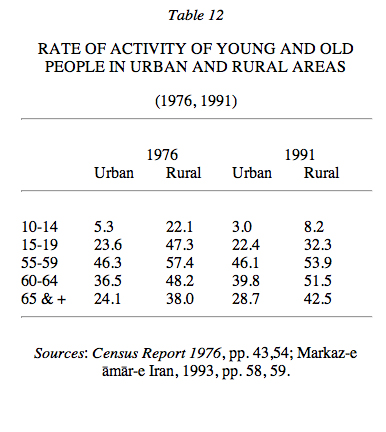
Urban/rural difference. In all the censuses the rate of activity of the population of 10 year-olds and over seems to be greater in urban areas than in rural areas. Two factors would account for this situation. Firstly, because of the lower level of schooling, the youth in rural areas mostly tend to look for employment (often in agriculture). And secondly, in the absence of a work age limit and a retirement scheme, the rural population continues to work up to an advanced age, as illustrated in Table 12.
The impact of the weight of these two extremities of the rates of economic activity and employment in rural areas brings about higher overall rates for the population of 10 year-olds and over in rural areas (Table 13).
Sectoral changes of employment and economic activity. The four Persian censuses give the number of population in the three major sectors of economic activity, namely: primary sector (agriculture), secondary sector (industry), tertiary sector (services).
Table 14 shows that in 1956 more than half the active population was engaged in agriculture, the two other sectors almost equally sharing the rest. In the period 1956-76, while the importance of the population working agriculture decreased, industry grew in proportions which is a normal process, especially as at the same time that “services” gained ground.
Between 1976 and 1986 we may observe a real migration, particularly from industry to services: there is a rise of 12 percentage points in the latter against a fall of 8 percentage points in the former. One would expect to find a reasonable explanation for this phenomenon in terms of economic cause and effect. Paradoxically, during the same period the share of services in the (non-oil) gross domestic product (GDP) has declined from 72 percent to 55 percent. In other words, more people are absorbed in the declining sector, which must indicate a significant fall in productivity, a critical phase in the employment structure in Persia.
So far as the distribution of active population by urban and rural areas in the three sectors are concerned, it can be observed that in rural areas it is the primary sector (agricultural) which constantly prevails over the two other sectors in all the four censuses from 1956 to 1986. However, a certain stabilization of the proportion of this sector at about 58 percent may be noted in 1976 and 1986. As for the proportion of active population in “industry,” it has remained fairly stable in urban areas in the first three censuses (1956, 1966 and 1976) between 36 percent and 38 percent, and has dropped in 1986 (30.9 percent). In rural areas the proportion of active population in “industry” has grown rapidly in the first three censuses and dropped by 10 points after the Revolution in 1986.
The tertiary sector has continued to remain dominant in urban areas. Nevertheless, in 1986 the proportion of active population engaged in “services” increased heavily in both urban and rural areas. In case of the latter, the percentage of active population engaged in services has doubled after the Revolution, to 21 percent in 1986, as compared to the three previous (pre-Revolution) censuses, hovering at around 11 percent.
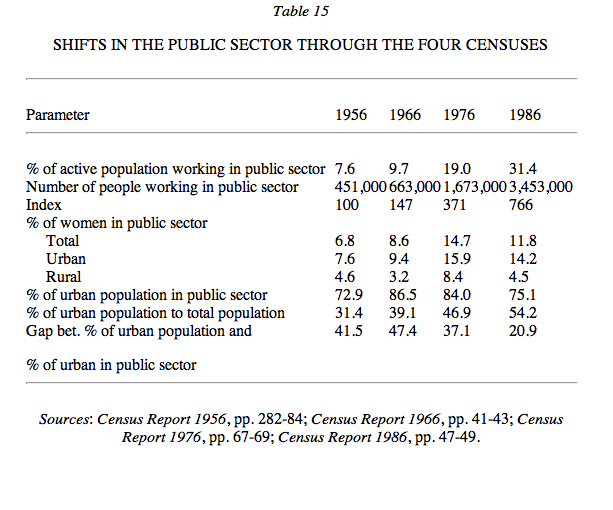
Public/Private sectors. One of the major factors contributing to the growth of services is the considerable number of people working for the government, that is, the civil service, which has been rising steeply. According to the census of 1986 (Table 15), 31 percent of the active population in Persia worked in the public sector. It may be noted, for instance, that during the post-revolutionary period, numerous government organizations and even new ministries were created. Notably among them are, the Ministry of Reconstruction Effort (Wezārat-e jehād-e sāzandagī), the Revolutionary Guards (Sepāh-e pāsdārān) and Mobilization Corps (Basīj-e mostażʿafān).
In 1986 a total of 3,453,000 people were employed by the public sector, 2.06 times the figure for 1976. But the most important increase in the active population working in the public sector occurred before the Islamic Revolution: 2.5 half times between 1966 and 1976.
It is also important to note that in 1976, 84 percent of government employees were city-dwellers, whereas the urban population represented only 47 percent of the total population of Persia. It seemed in 1986 that the situation was approaching a kind of equilibrium, with 75.1 percent of the public sector employees working in the cities for an urban population of 54.2 percent, a reduction of the gap between the urban part of the public sector and the percentage of urban population. This gap was 20.9 points in 1986, against 37.1 points for 1976 and 47.4 points for 1966. Having occurred in the middle of the war, this development may be interpreted as an indication of the greater attention paid to rural areas (the geographical source of production of foodstuffs) by the government as a part of its wartime economic policy.
Finally, it may be noted that in 1986 the share of women in the public sector has dropped, one of the major causes of which could have been the priority given by the government to men in the ministries and public organizations.
Bibliography (for Census Reports see National Census in “Short References”):
M. ʿAlīzāda, “Rošd-e jamʿīyat, tawseʿa wa ešteḡāl; čašm-andāz-e mobham,” in Ādīna, no. 34, Ordībehešt 1368 Š./1989, pp. 12-18.
F. Amīnzāda, Demogrāfī-e kār, Entešārāt-e Dānešgāh-e mellī-e Īrān, no. 181, Tehran, 1358 Š./1979.
Markaz-e āmār-e Iran, Barrasī-e jāmeʿ-e jamʿīyat-e Īrān1370, Tehran, 1372 Š./1993.
Idem, Barrasī-e jāmeʿ-e jamʿīyat-e Īrān1372, Tehran, 1373 Š./1994.
Idem, Nemūna-gīrī-e jamʿīyat-e Īrān 1373, Tehran 1374 Š./ 1995.
M. Hedāyat, “Morūrī bar sīāsathā-ye nīrū-ye ensānī-e Īrān, 1335-1371,” in Majalla-ye jamʿīyat, Summer 1371Š./1992.
J. Javān, “Jamʿīyat wa manābeʿe ensānī , in Kelk, no. 57, 1373 Š./1994, pp. 113-23.
J. Salehi-Esfahani, Population Growth and Intensification in Iranian Agriculture, International Union for the Scientific Study of Population Paper no. 10, Liege, 1976.
Ḥ. Zanjānī, Jamʿīyat wa tawseʿa, Ministry of Housing, Tehran, 1371 Š./1992.
(M. Amani)
Originally Published: December 15, 1998
Last Updated: December 15, 2011
This article is available in print.
Vol. VIII, Fasc. 4, pp. 416-421
M. Amani, “EMPLOYMENT,” Encyclopaedia Iranica, VIII/4, pp. 416-421, available online at http://www.iranicaonline.org/articles/employment (accessed on 30 December 2012).