


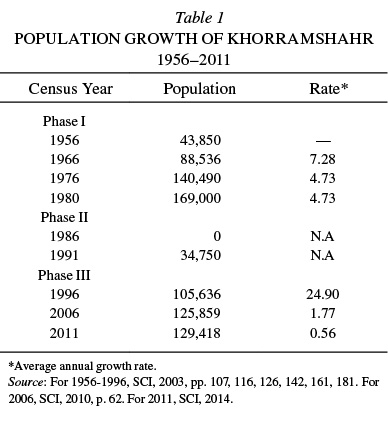
Population growth. The population growth of Khorramshahr from the first national census in 1956 to the latest one in 2011 may be divided into three different phases: first, before the Iran-Iraq war of 1980-88 (see IRAQ vii); second, during the war and its aftermath from 1980 to 1991; and third, the period from 1991 to 2011. The first phase witnessed a rapid population growth with a very high rate of 7.28 percent per year between 1956 and 1966 and 4.73 percent between 1966 and 1976.
Since Khorramshahr was occupied by the Iraqi forces during the second phase, the inhabitants evacuated the town; in spite of its recapture by Iranian armed forces in 1982, the city and its port were completely destroyed to the point that no one could stay there, and the city remained a ghost town. As a result, Khorramshahr had no recorded population in the 1986 national census. However, after a couple of years, when the primary reconstruction was completed, war refugees started to return to their homes, and the population of Khorramshahr increased to 34,750 people in 1991.
From 1991 to 2006, when many survivors of the war returned, the population leaped to 105,636 in 1996 with an average annual growth rate of nearly 25 percent. Afterwards, the average growth rate dropped to 1.77 percent per year between 1996 and 2006, and to 0.56 percent per year between 2006 and 2011, when the population grew slowly to 125,859 and 129,418, respectively (Table 1).
Age structure The population of Khorramshahr can still be considered as young. In 2011, almost 69.3 percent of the population were in the activity ages of 15 to 64; 26.5 percent were below 15 years of age, and only 4.2 percent were 65 and over. This age structure is significantly younger than that of national urban areas as a whole. The age structure in 2006 was even younger than that in 2011 and also younger than that of urban areas as a whole in the same year (for 2006, SCI, 2010, p. 56, and SCI, III, 2009a, pp. 21-22. For 2011, SCI, 2014).
Literacy rate. In 2006, almost 86.9 percent of the population of Khorramshahr six years of age and over were literate. The literacy ratio was higher for males (90.9 percent) than for females (82.9 percent; SCI, 2010, Table 4, p. 151). But comparison to urban areas in general, either for both sexes (88.9 percent) or for each sex (92.2 percent for male and 85.6 percent for female; SCI, 2009b, pp. 223, 225, 227) suggests lower literacy conditions in Khorramshahr.
Economic activity status. In 2006, almost 82.71 percent of the population of Khorramshahr, or 104,093 people, were in the activity ages (i.e., 10 years of age and over), of whom 36.7 percent were economically active and 62.5 percent inactive, while the status of the rest (0.8 percent) was unknown (SCI, 2010, p. 188). The activity ratio in Khorramshahr was lower than the national average ratio for cities (38.8 percent; SCI, 2009b, p. 35). Employment and unemployment ratios of the active population in Khorramshahr were estimated at 79.3 percent and 20.7 percent, respectively. These figures indicate the ratio of employment in Khorramshahr was significantly lower than that in urban areas of the country as a whole (with 88.2 percent employed and 11.8 percent unemployed; for 2006, SCI, 2010, p. 179, and SCI, 2009b, p. 50; for 2011, SCI, electronically disseminated results of 2011 national population and housing census available at https://nnt.sci.org.ir).
Between 2006 and 2011, although the economic activity status had been getting worse in both Khorramshahr and urban areas of the country as a whole, the trend was faster for Khorramshahr. In that city, the population in activity ages dropped to 80.96 percent, indicating the reduced capacity of the human labor force in the city (SCI, 2015). Despite that reduction, the proportion of the active population also decreased from 36.7 percent to 34.95 percent. The most remarkable decrease occurred in the employment ratio, falling from almost 80 percent to 70 percent. The same pattern can also be seen for urban areas as a whole, but the changes are not as fast as in Khorramshahr, resulting in even more of a gap between the city and the urban areas of the country as a whole.
Bibliography
[SCI] Statistical Center of Iran (Markaz‑e āmār-e Irān), “Šahrestān-e Ḵorramšahr,” Tehran, 1956, 1966, 1976, 1986, 1996, 2006, and 2011.
Idem, Tawziʿ wa ṭabaqa-bandi-e jamʿiyat-e šahrhā-ye kešvar dar saršomārihā-ye 1335-75 wa taṭbiq-e tawziʿ-e joḡrāfiāʾi-e jamʿiyat-e ostānhā 1382, Tehran, 2003.
Idem, Natāyej-e saršomāri-e ʿomumi-e nofus va maskan‑e 1385: jamʿiyat-e šahrhā-ye kešvar bar ḥasab-e sen va jens, koll-e kešvar III, Tehran, 2009a.
Idem, Saršomari-e ʿomumi-e nofus va maskan‑e 1385: natāyej-e tafṣili, koll-e kešvar I, Tehran, 2009b.
Idem, Gozida-ye namāgarhā-ye jamʿiyati-e šahrhā-ye kešvar bar asās-e natāyej-e saršomāri-e ʿomumi-e nofus va maskan-e 1385, Tehran, 2010.
Idem, “2011 Census Selected Results—UNFPA Iran,” electronically published, 2014; available at http://iran.unfpa.org/view_news.asp?id=248 (accessed 15 June 2015).
Idem, “2011 Census Selected Results,” electronically published, available at https://nnt.sci.org.ir.