


BĀBOL
iii. Population, 1956-2011
This article deals with the following population characteristics of Bābol city: population growth from 1956 to 2011, age structure, average household size, literacy rate, and economic activity status for 2006 and/or 2011 (different dates for the categories are determined by the availability of census data).
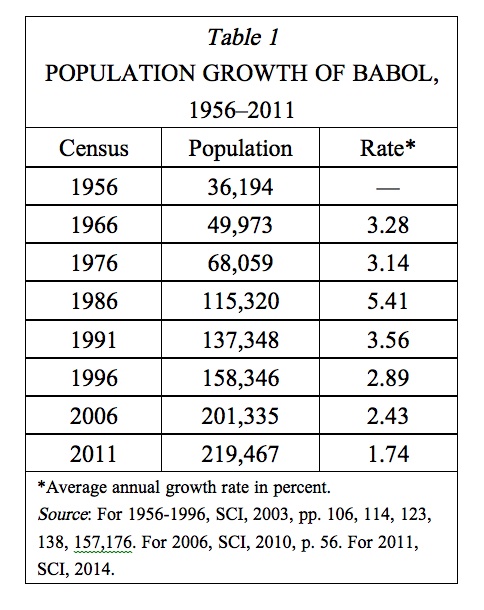
Population growth. Bābol has experienced a rather moderate but declining rate of population growth (except during the Iran-Iraq War; see IRAQ vii), increasing sixfold from a population of 36,194 in 1956 to 219,467 in 2011. During the period 1956-76, the average annual growth rate was 3.21 percent, with population increasing from 36,194 to 68,059 people. From 1976 to 1986, the population growth rate of Bābol reached a value of 5.41 percent per year, as the population reached 115,320 people. Since Bābol was one of the safer cities in the country during the Iran-Iraq War, this increase may be attributed to war-related population movements.
As the war came to an end (i.e., after the cease-fire of 1988), the population growth rate for Bābol dropped to 3.56 percent per year between 1986 and 1991 and to 2.89 percent per year between 1991 and 1996; the population reached 173,348 in 1991 and 158,346 in 1996. Since then, the annual population growth rate for Bābol has continued to decrease, falling to 2.43 percent between 1996 and 2006 and to 1.74 percent between 2006 and 2011, as the population grew from 158,346 in 1996 to 201,335 in 2006 and to 219,467 in 2011 (Table 1).
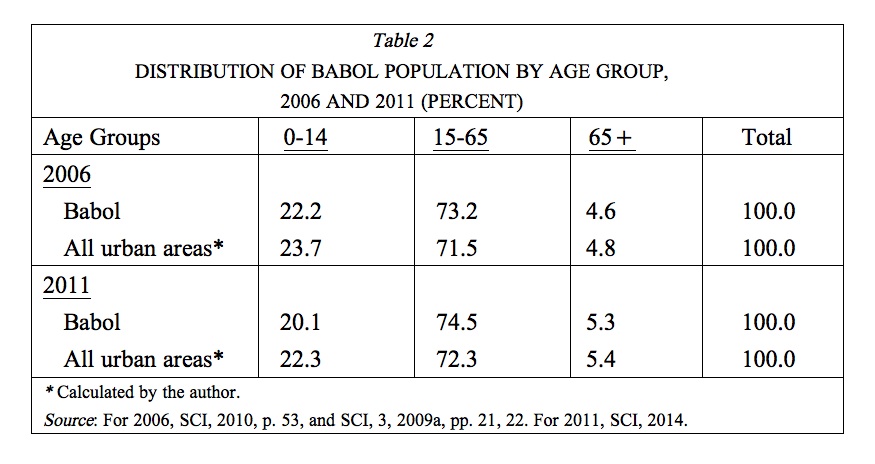
Age structure. The population of Bābol can still be considered as young. In 2011 almost 74.5 percent of the population were in the activity ages of 15 to 64; another 20.1 percent were below 15 years of age, and only 5.3 percent were 65 and over. The age structure in 2006 was even younger than that of 2011 but not younger than that of urban areas of the country as a whole in the same year (Table 2).
Average household size. In 2006, the average household size in the city of Bābol was 3.6 persons per household (National Census, 2006, SCI, 2010, p. 85), which was lower than the average of 3.89 for urban areas as a whole (SCI, 2009b, p. 50). In 2011 the average size declined to 3.3 persons per household (SCI, 2014), not significantly lower than the average size of 3.48 for the urban areas as a whole (SCI, 2014).
Literacy rate. In 2006, almost 91.2 percent of the population of Bābol six years of age and over were literate. The literacy ratio was significantly higher for males (93.9 percent) than for females (88.9 percent; SCI, 2010, Table 4, p. 145). Comparison to urban areas in general, either for both sexes (88.9 percent) or for each sex (92.2 percent for male and 85.6 percent for female; SCI, 2009b, pp. 223, 225, 227), suggests a higher literacy rate in Bābol.
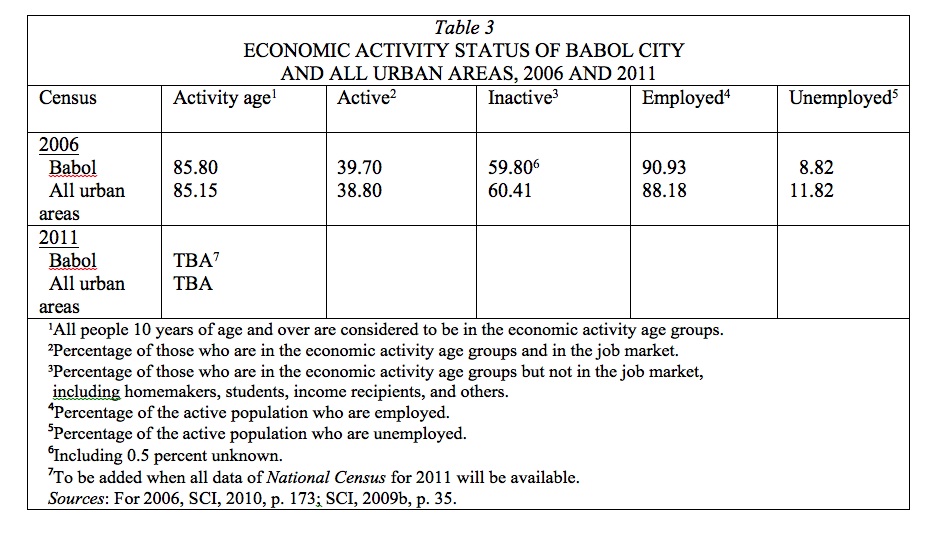
Employment status. In 2006, almost 85.8 percent of the population of Bābol, or 172,816 people, were in the activity ages (i.e., 10 years of age and over), of whom 39.7 percent were economically active and 59.8 percent inactive, while the status of the rest (0.5 percent) was unknown (SCI, 2010, p. 177). The activity ratio in Bābol is slightly higher than the national average ratio for cities (38.8 percent, SCI, 2009b, p. 35). The employment and unemployment ratio of the active population in Bābol is estimated at 90.93 percent and 8.82 percent, respectively (SCI, 2010, p. 176). These figures indicate the ratio of employment in Bābol is higher than that in urban areas in the country as a whole (Table 3).
Bibliography (for cited works not given in detail, see the EIr Short Titles):
National Census, Bojnurd Sub-province, 1956, 1966, 1976, 1986, 1996, 2006, and 2011.
SCI (Statistical Center of Iran [Markaz-e āmār-e Irān), Tawziʿ wa ṭabaqa-bandi-e jamʿiyat-e šahrhā-ye kešvar dar saršomārihā-ye 1335-75 [years 1956-196], wa taṭbiq-e tawziʿ-e joḡrāfiāʾi-e jamʿiyat-e ostānhā 1382 [year 2003], Tehran, 2003.
Idem, Natāyej-e saršomāri-e ʿomumi-e nofus va maskan-e 1385 [year 2006], jamʿiyat-e šahrhā-ye kešvar bar ḥasab-e sen va jens, koll-e kešvar III, Tehran, 2009a.
Idem, Saršomari-e ʿomumi-e nofus va maskan-e 1385 [year 2006], natāyej-e tafṣili, koll-e kešvar I, part 1, Tehran, 2009b.
Idem, Gozida-ye namāgarhā-ye jamʿiyati-e šahrhā-ye kešvar bar asās-e natāyej-e saršomāri-e ʿomumi-e nofus va maskan-e 1385 [year 2006], Tehran, 2010.
Idem, “2011 Census Selected Results—UNFPA Iran,” electronically published, 2014; available at http://iran.unfpa.org/view_news.asp?id=248 (accessed 15 June 2015).