




The population of Tajikistan grew at an unprecedented rate during the 20th century. From an estimated 1,034,400 people in 1913 within the present boundaries of the republic (143,100 km2), it rose to 5,092,603 in 1989, the year of the last Soviet census, and to an estimated 5,600,000 in 1993, an increase of 440 percent over eighty years. The increase was not a steady one, however. Two phases can be distinguished. Between 1913 and 1922 the population dropped to 956,300 (-7.6 percent) as a consequence of civil war and famine (for a general review, see Buttino). Recovery was slow; during the period 1929-59 the population grew only 64 percent (from 1,207,000 inhabitants in 1929 to 1,484,900 in 1939 and 1,980,547 in 1959), but in the next thirty years it grew more than 157 percent (to 2,899,602 inhabitants in 1970 and 3,806,220 in 1979), as the region continued in the phase of demographic transition (see below). There has thus been an almost fivefold overall increase in less than sixty-five years. The average population density, which barely exceeded 7 inhabitants per km2 in 1913 and 10 in 1939, is now approaching 40.
Causes of demographic evolution. Two main factors account for this evolution. The primary factor is high natural growth. The Soviet regime emphasized modernization of health services through such measures as vaccination campaigns, construction of hospitals and dispensaries, and provision of safe drinking water. In Tajikistan the ratio of hospital beds per 10,000 inhabitants rose from 0.4 in 1913 to 28.6 in 1940, 98.8 in 1980, and 105.8 in 1990; the ratio of physicians per 10,000 inhabitants from 0.2 in 1913 to 4.1 in 1940, 23.5 in 1980, and 27.1 in 1990 (Narodnoe khozyaistvo TSSR [The national economy of the Tajik S.S.R.], various editions). The mortality rate consequently declined from 14.1 per thousand in 1940 to 8.2 per thousand in 1950 and 5.1 per thousand in 1960; for reasons that are unclear, perhaps more efficient registration of deaths, it then increased to 6.3 per thousand in 1970 and 8 per thousand in 1980 before declining again through the 1980s (7 per thousand in 1985, 6.2 in 1990). Life expectancy at birth reached 69.4 years in 1990, the highest figure in former Soviet Central Asia, with a comparatively slight difference between that for males (66.8 years) and that for females (71.9 years). Infant mortality remained high, however (58.1 per thousand in 1980, 40.7 in 1990, the second highest rate in the U.S.S.R., after Turkmenistan); even in the capital, Dushanbe, where the medical infrastructure is comparatively advanced, infant mortality was 32.9 per thousand in 1990, though it had declined significantly from 59 per thousand in 1980. In the provincial town of Kurgan Tyube, in the Vakhsh (Vaḵš) valley south of Dushanbe, it dropped from 80.5 to 40 per thousand in the same period. A comparative analysis of selected causes of death in the republics of the former U.S.S.R. shows that Tajikistan had the highest rate of death from infectious disease (12.8 percent of all deaths) but the lowest rate of deaths from neoplasms (8.4 percent) and afflictions of the circulatory system (31 percent); the epidemiology of the region thus clearly reflects the low level of socioeconomic development in Tajikistan (Cole and Cole, pp. 6 ff.).
On the other hand, the birthrate remained very high, owing to lack of sex education, prevalence of Muslim conservative attitudes, and early marriage (see below). It has steadily increased from 30.6 per thousand in 1940 to 33.5 in 1960, 37 in 1980, and 38.8 in 1990, by far the highest in Soviet Central Asia. The corresponding fecundity index was 174 births per 1,000 women aged fifteen to forty-nine years in 1990, compared to 150 in 1960. This increase may be explained by a general improvement in female health and by the fact that the steadily increasing number of women of childbearing age counterbalances the effects of a real decrease in individual fertility (from a maximum average of 6.3 children per woman in 1975 to 5.5 in 1984 and 5.1 in 1989; Blum, p. 357; Gosudarstvennii Komitet [G.K.S.], p. 314).
The natural growth rate consequently soared from 16.5 per thousand in 1940 to 28.4 in 1960, 29 in 1980, and 32.6 in 1990, with an absolute maximum so far of 35.2 in 1986, a typical example of “high” demographic transition.
Tajikistan was unique in Soviet Central Asia in the age and sex structure of its population. It had the highest proportion of youngsters fourteen years old and under (43.2 percent in 1990), the lowest proportion of elders aged sixty-five years or more (3.8 percent), and the highest dependency index (i.e., population in these two age groups as a percentage of population aged fifteen to sixty-four years: 88.6 in 1990, compared to 92.3 in 1979). Tajikistan also had the highest ratio of males to females: 98.7 in 1990, compared to 97.7 in 1979. The excess of females reflected higher mortality among adult males.
Marriage statistics reflected the impact of traditional Muslim standards. The marriage rate was very high and concentrated among young people. In 1970, 40.4 percent of women aged eighteen and nineteen years were married (49.6 percent among rural women in this age group), a proportion that had declined only slightly since 1959 (43.8 percent and 52.3 percent, respectively) and was the highest in Central Asia (Blum, p. 346). It was undoubtedly an important factor in the high fertility rate and generally large family size.
The momentum of natural growth was further enhanced by the second determining factor, massive immigration of European populations, mainly Russians. In the first decades of the Soviet regime the number soared from a mere few thousand to several hundred thousand; a parallel though perhaps less massive influx of Ukrainians, Belorussians, and Germans also took place (Table 23). Half this immigrant population, mainly technicians, professionals, and skilled workers, was established in Dushanbe (195,000 Russians out of a total population of 388,000 in 1989). Until the 1960s continuing immigration of Europeans considerably lowered the ratio of Tajiks (Table 23). Since the mid-1970s, however, the number of Russians leaving Tajikistan has surpassed immigration; the trend approached a hemorrhage after the proclamation of Tajik independence in 1991. It is reported that more than 75 per cent of the Russian population (300,000 out of 388,000) left Tajikistan between 1989 and 1993 (Rotar’). Russian Jews and Tatars have also left in massive numbers.

The population of Tajikistan is characterized by high mobility; in 1989, 22.8 per cent of the inhabitants were not living in their birthplaces. Mobility was significantly higher among Russians (56.7 percent) than among Tajiks (18.4 per cent) or Uzbeks (17 per cent).
Ethnic and geographical factors. All these general trends and characteristics conceal considerable demographic variation among national groups. In general the European minorities have accepted family planning and birth control (Watters, p. 80), for example, whereas local Muslims have not. This difference has contributed to the continuous decline of the European proportion of the total population from a peak of more than 16 percent in 1959 to 12 percent in 1979 and 9 percent in 1989 (Table 23). The Muslims themselves are not demographically homogeneous. The Uzbeks, who account for almost a quarter of the total population, are less fertile than the Tajiks, whose birth rate was as high as 42.9 per thousand in 1989, 4 index points above the general birth rate for the republic (Watters, p. 76; G.K.S., p. 185).
The proportion of the population in cities, thus more secularized, better educated, and more receptive to such Western (Russian) cultural ideas as family planning, sharply increased, from about 9 percent in 1913 and 7 percent in 1922, when the region was the least urbanized in Central Asia, to 17 percent in 1939, 33 percent in 1959, and 38 percent in 1975. Since 1975, however, it has been steadily declining (35 percent in 1979, 32 percent in 1990) because of the increasing differential in fertility between cities and villages: Respective birthrates were 28.5 and 43.6 per thousand in 1990, with respective extremes of 22.4 in Dushanbe and 48.8 in rural Kurgan Tyube oblast; in 1989 the fertility index was 3.4 children per woman in towns, 6.1 in the countryside. Urban and rural death rates were, however, very similar: 6.4 and 6.2 per thousand respectively, with respective extremes of 4.8 in Khorog city and 6.9 in rural Gorno-Badakhshan. The similarity reflects differences in age structure, rather than medical facilities. The gap in natural growth between urban and rural dwellers thus reached 15.3 per thousand, to the advantage of the latter, an unprecedented figure (cf. 13 per thousand in 1980, 14 per thousand in 1985). It should be emphasized that ethnic Tajiks remain predominantly village dwellers (74.5 percent in 1970).
It is not yet possible to assess all the demographic consequences of the civil war that broke out in 1991. Current press estimates are 40,000 dead and another 40,000 refugees in northern Afghanistan at the end of 1993 (compared to 60,000-70,000 in 1992).
See also CENTRAL ASIA ii.
Bibliography
A. Blum, “La transition démo-graphique dans les républiques orientales d’URSS,” Population 42/2, 1987, pp. 337-58.
M. Buttino, “Study of the Economic Crisis and Depopulation of Turkestan, 1917-1920,” Central Asian Survey 9/4, 1990, pp. 59-74.
J. P. Cole and R. P. Cole, Causes of Death in the USSR in 1989, University of Nottingham, Department of Geography Working Paper 15, Nottingham, 1992.
Gosudarstvennii Komitet SSSR po Statistike, Demograficheskii ezhegodnik SSSR 1990 (Demographic yearbook, U.S.S.R., 1990), Moscow, 1990.
S. I. Islomov, Demografiya Tadzhikistana (Demography of Tajikistan), Dushanbe, 1985.
L. Krader, Peoples of Central Asia, Bloomington, Ind., 1966.
I. Rotar’, “Slavyane v Srednei Azii. Adaptatsiya ili begstvo?” (Slavs in Central Asia. Adaptation or flight?), Nezavisimaya Gazeta, 29 April 1993.
Kh. S. Salimov, Naselenie Srednei Azii (The population of Central Asia), Tashkent, 1975.
Sovetskii Tadzhikistan za 50 let. Sbornik statisticheskikh materialov (Soviet Tajikistan after 50 years. Collection of statistical material), Dushanbe, 1975.
Statkomitet Soobshchestvo nezavisimykh gosu-darst, Demograficheskii ezhegodnik 1991 (Demographic yearbook, 1991), Moscow, 1991.
K. Watters, “The Current Family Planning Debate in Soviet Central Asia,” Central Asian Survey 9/1, 1990, pp. 75-86.
Figure 12. Distribution of population and growth in Persia, by šahrestān, 1365-70 Š./1986-91.

Figure 13. Population tree, Persia, 1370 Š./1991. After Markaz-e āmār, 1371 Š./1992.

Figure 14. Birth rate in Persia per 1,000, by šahrestān, 1365 Š./1986.
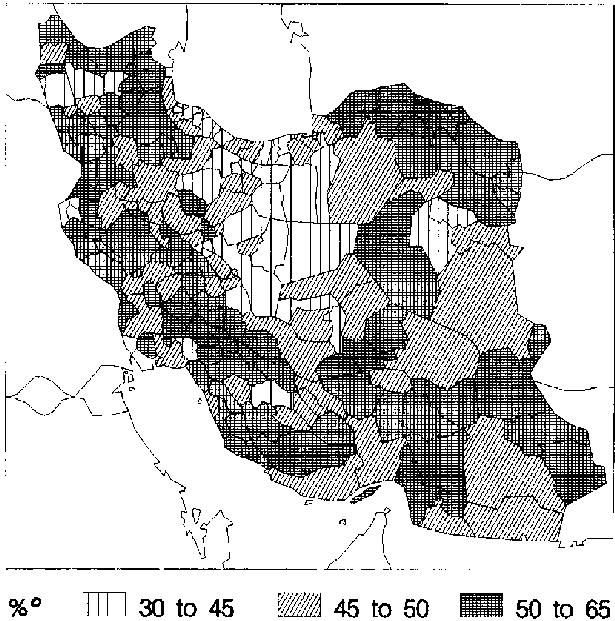
Figure 15. Knowledge of Persian, as represented by percentages of those claiming to understand it, by šahrestān, 1365 Š./1986.

Figure 16. Population density in Afghanistan, by province, according to the censut of 1 1358 Š./1979; figures represent inhabitants per km². After Central Statistics Office.
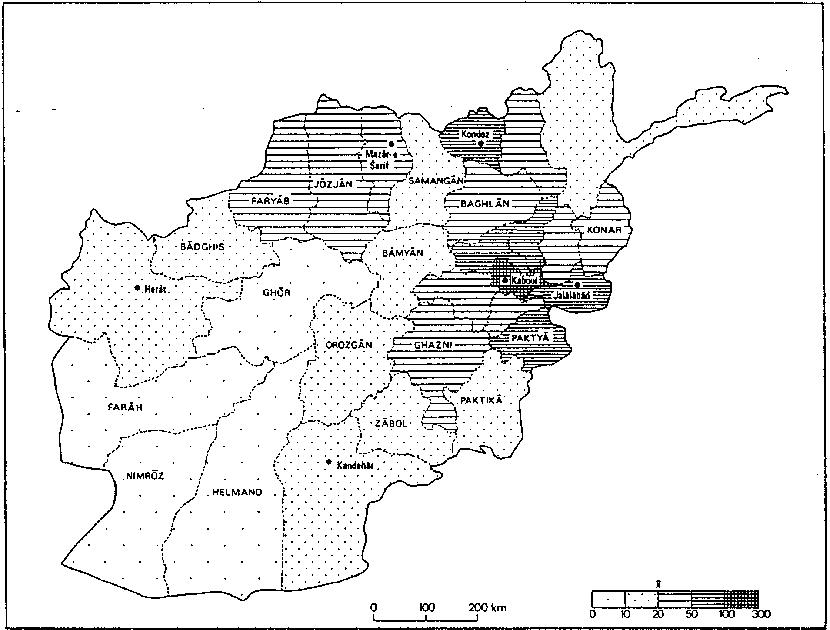
Figure 17. Population density in Afghanistan, by province, at the end of the 1980s; figures represent inhabitants per km². After Eighmy.
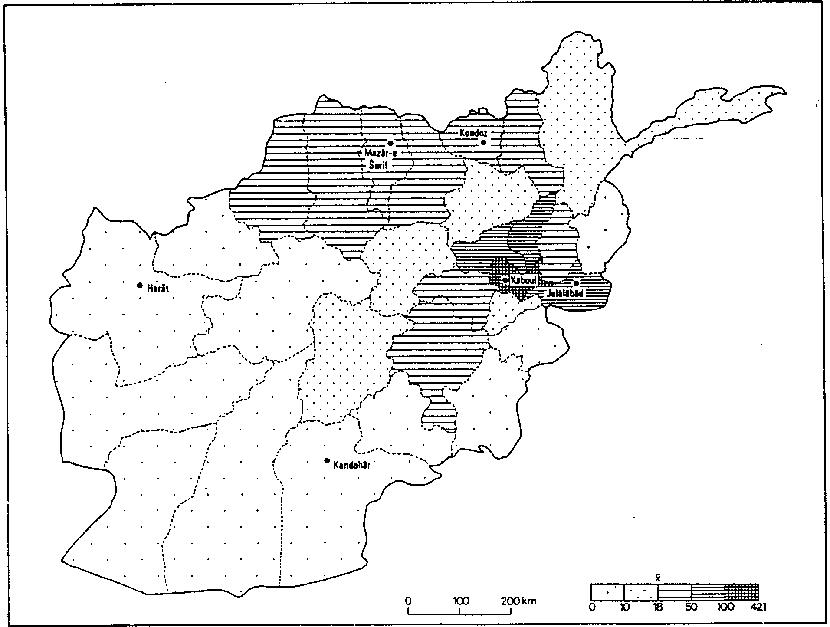
Table 10. Evolution of the Population of Persia, 1900-91
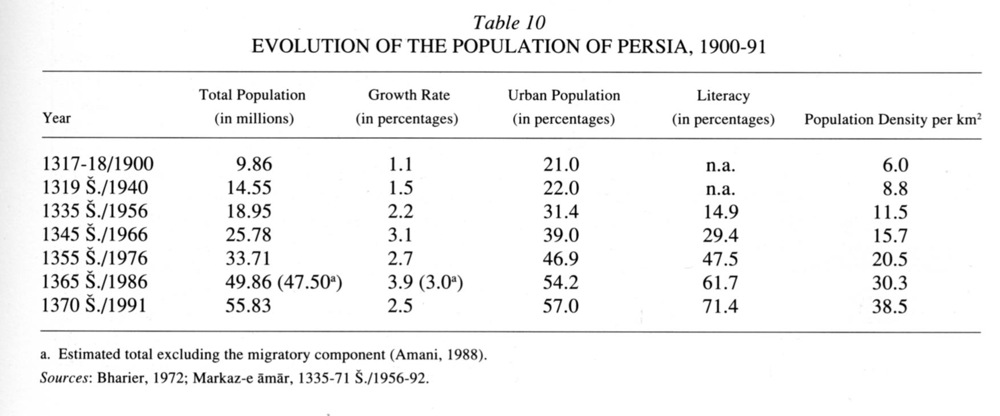
Table 11. Evolution of the Persian Population by Age Group, 1335-1379 Š./1956-2000
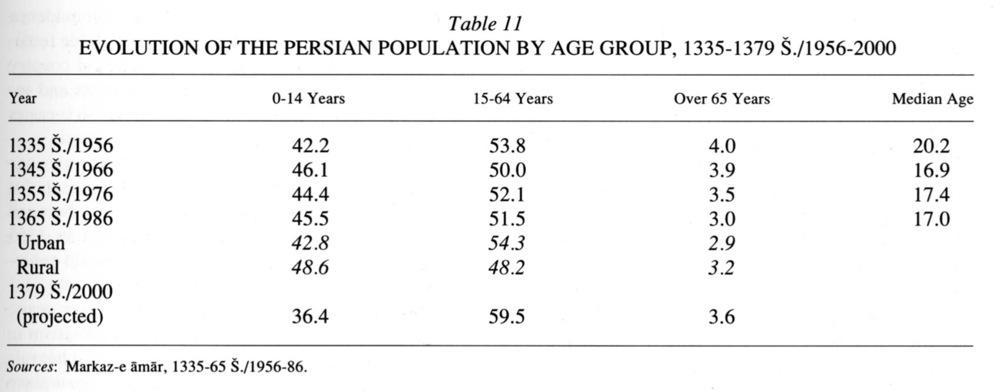
Table 12. Percentage of Males in the Total Persian Population, 1335-65 Š./1956-86

Table 13. Fertility in Persia, 1900-91
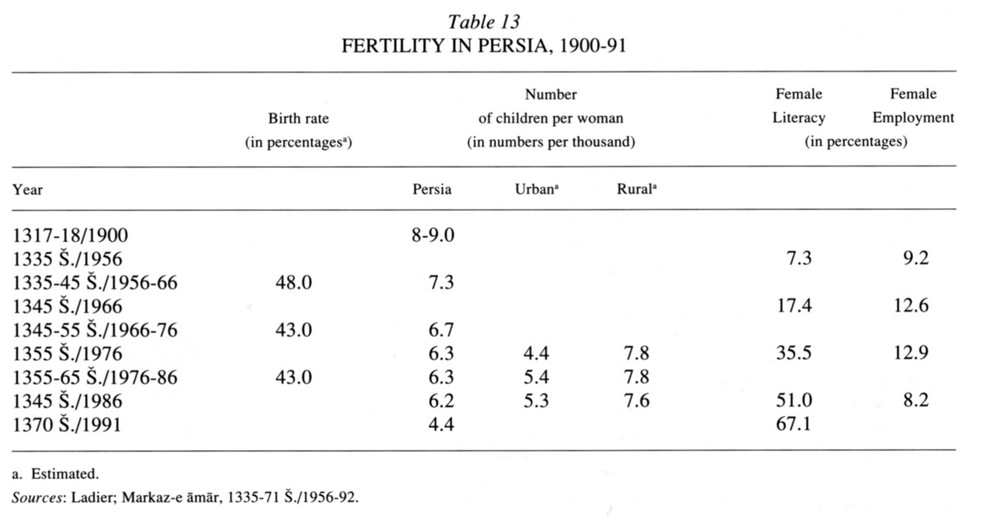
Table 14. Mortality in Persia, 1329-69 Š./1950-90
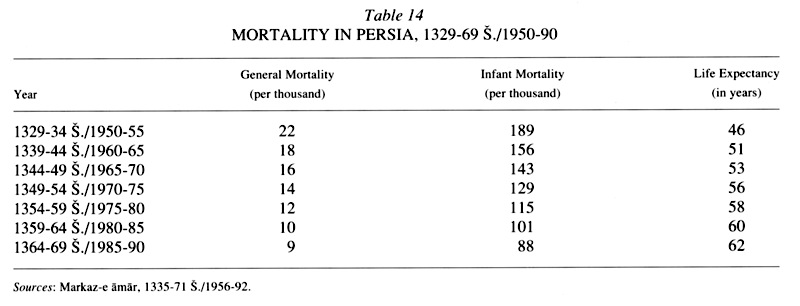
Table 15. The Persian Family, 1335-70 Š./1956-91
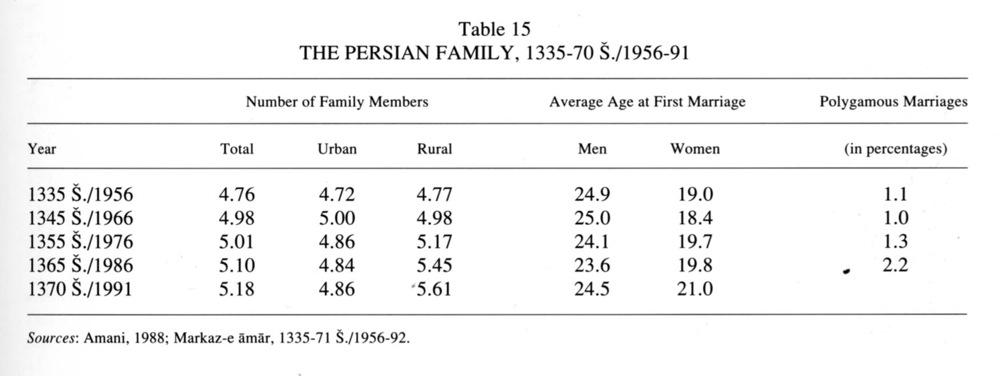
Table 16. Migratory Populations in Persia, 1335-70 Š./1956-91
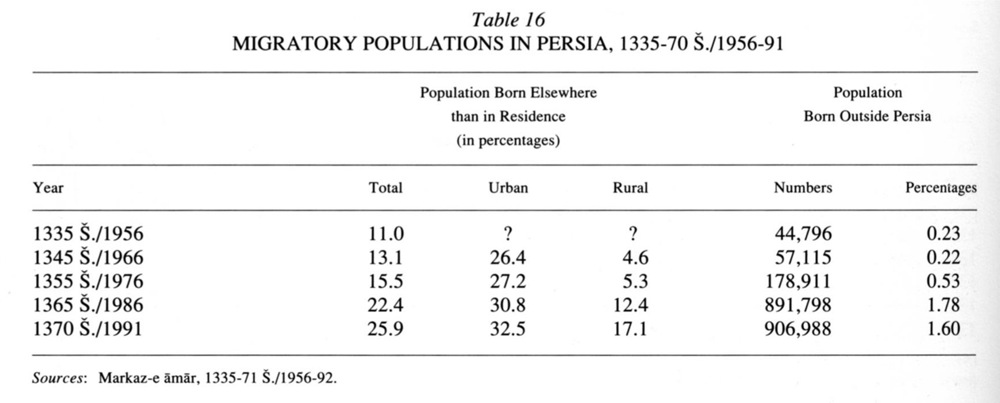
Table 17. Urbanization in Persia, 1335-70 Š./1956-91
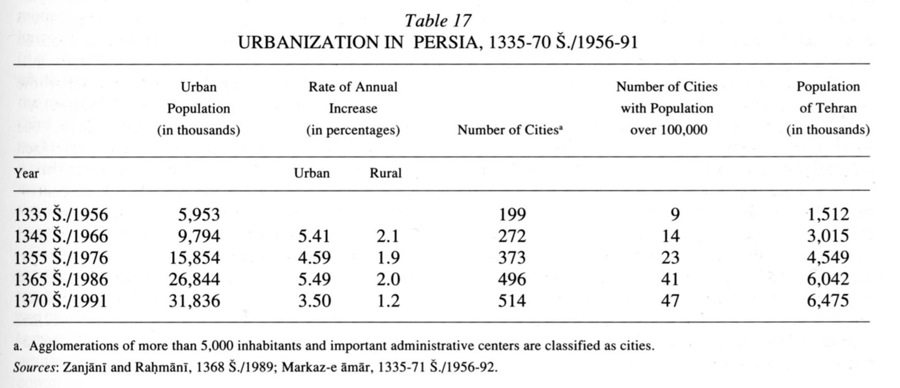
Table 18. Literacy Rates in Persia, 1335-70 Š./1956-91
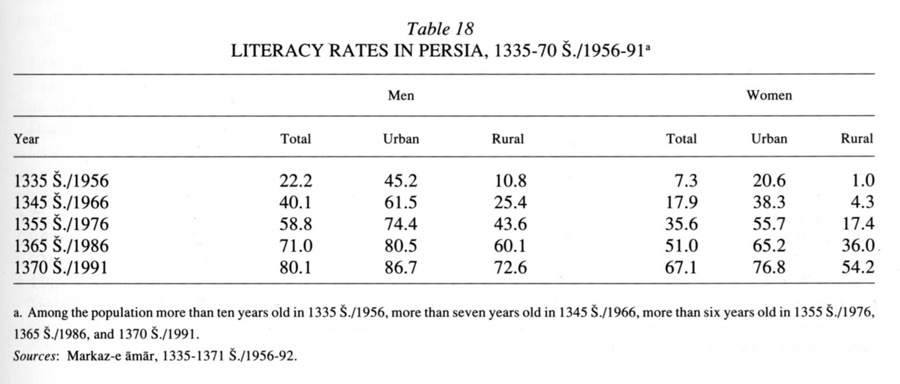
Table 19. Religious Minorities in Persia, 1335-65 Š./1956-86
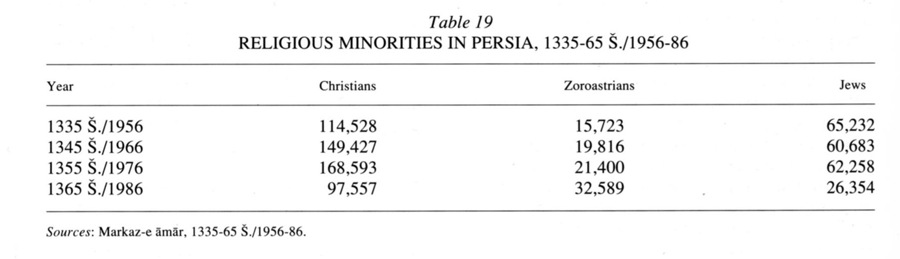
Table 20. Employment Trends in Persia, 1335-65 Š./1956-86
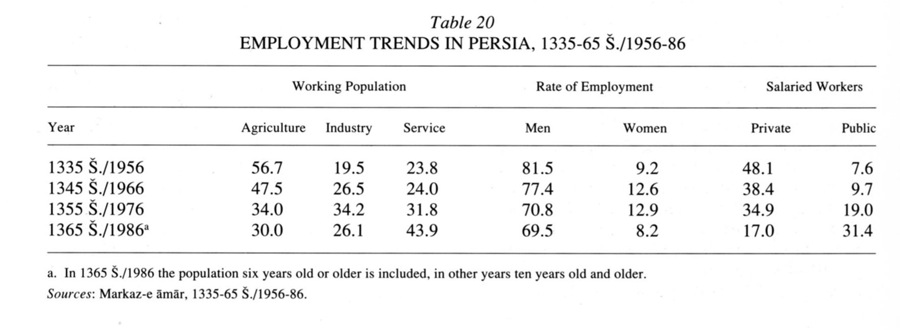
Table 21. Estimates of the Population of Afghanistan at Various Dates

Table 22. Officially Registered Refugees in Pakistan and Persia
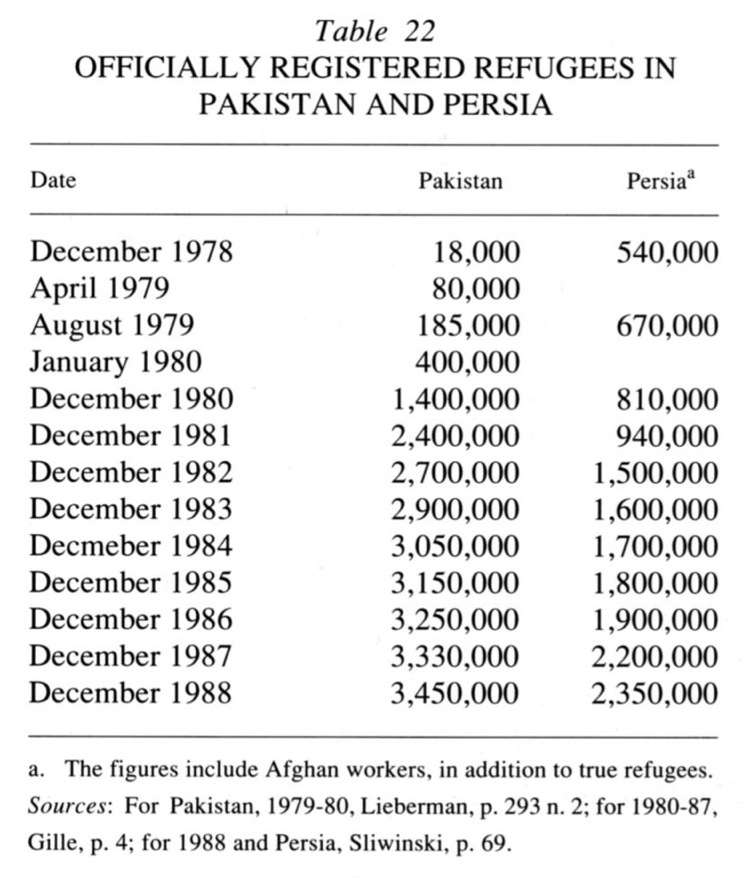
Table 23. Ethnic Composition of the Tajik A.S.S.R./S.S.R.