

POPULATION BEFORE 2004

Figure 1. Administrative divisions of the Khorasan provinces as of 2020. Note that boundaries are subject to frequent changes; those shown are unofficial and approximate. Map background based on USGS data.
Introduction. In pre-modern historical periods, “Greater Khorasan” (see KHORASAN i. CONCEPT OF KHORASAN) included what is now the Khorasan region of Iran as well as parts of Afghanistan, Tajikistan, and Turkmenistan. Following the formal delineation of the boundaries between Iran, Afghanistan, and Russia, Khorasan generally referred only to the province making up most of the northeastern region of Iran. In 2004, the Khorasan province of Iran was divided into three new provinces (Figure 1), called North Khorasan (Ḵorāsān-e Šemāli), Razavi Khorasan (Ḵorāsān-e Rażawi) and South Khorasan (Ḵorāsān-e Janubi). Consequently, this article will deal first with the population of Khorasan province up to 2003, the year before the division, and, except for register data, sample surveys, or case studies, the data will be mostly from official census results from 1956 to 1996, the year of the last national census before the division of the province. Subsequent sections will cover the population of the three new provinces.
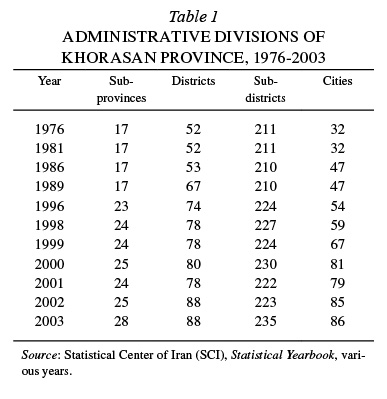
In the 20th century, Khorasan province, with an area of approximately 314,283 km2 (almost 20 percent of the country), was the largest province in Iran. It was bounded by Turkmenistan on the north; Afghanistan to the east; Sistān, Baluchistan, and Kerman provinces to the south; and Yazd, Semnan, and Golestan provinces to the west. Just prior to being divided into the three new provinces, Khorasan province consisted of 28 subprovinces (šahrestān), 88 districts (baḵš), 235 subdistricts (dehestān), and 86 cities (Table 1). There were also 16,052 settlements (ābādi), of which 8,012 were occupied (others were occupied only seasonally or were uninhabited man-made structures counted as “settlements”).
Population. Basic population figures for the period 1956-2003 may be found in Table 2. According to the results of the 1996 National Census, Khorasan province had a population of 6,047,661, with 1,283,207 households (Table 2). The population density equalled 18.25 people per km2. More than half (56.6 percent) of the population lived in urban areas and 43.4 percent lived in the rural areas. Five years earlier, in 1991, the province population had been 6,013,200, forming 1,193,637 households. The density of population was 18.1 people per km2 and 51.0 percent of the population of the province lived in urban areas.
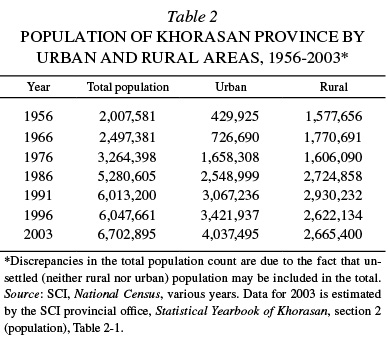
According to the figures provided in Table 2, the average annual population growth rate of Khorasan during the period 1956-2003 was generally declining, dropping from 1.21 percent in the first decade to 0.11 percent in the period 1991-96, but it was estimated to be 1.48 during the period 1996-2003. There had been a sharp fluctuation during the periods 1976-86 and 1986-91, when the annual growth rate of the population reached 4.95 percent and 2.82 percent respectively. This can be considered as mostly due to population movements caused by the Islamic Revolution in Iran (1979), as well as the beginning of the Iran-Iraq War (q.v.; 1980), which caused people to move from the southwest to the northeast of the country, including Khorasan province. This trend in population growth was true for both the urban and the rural areas of the province.
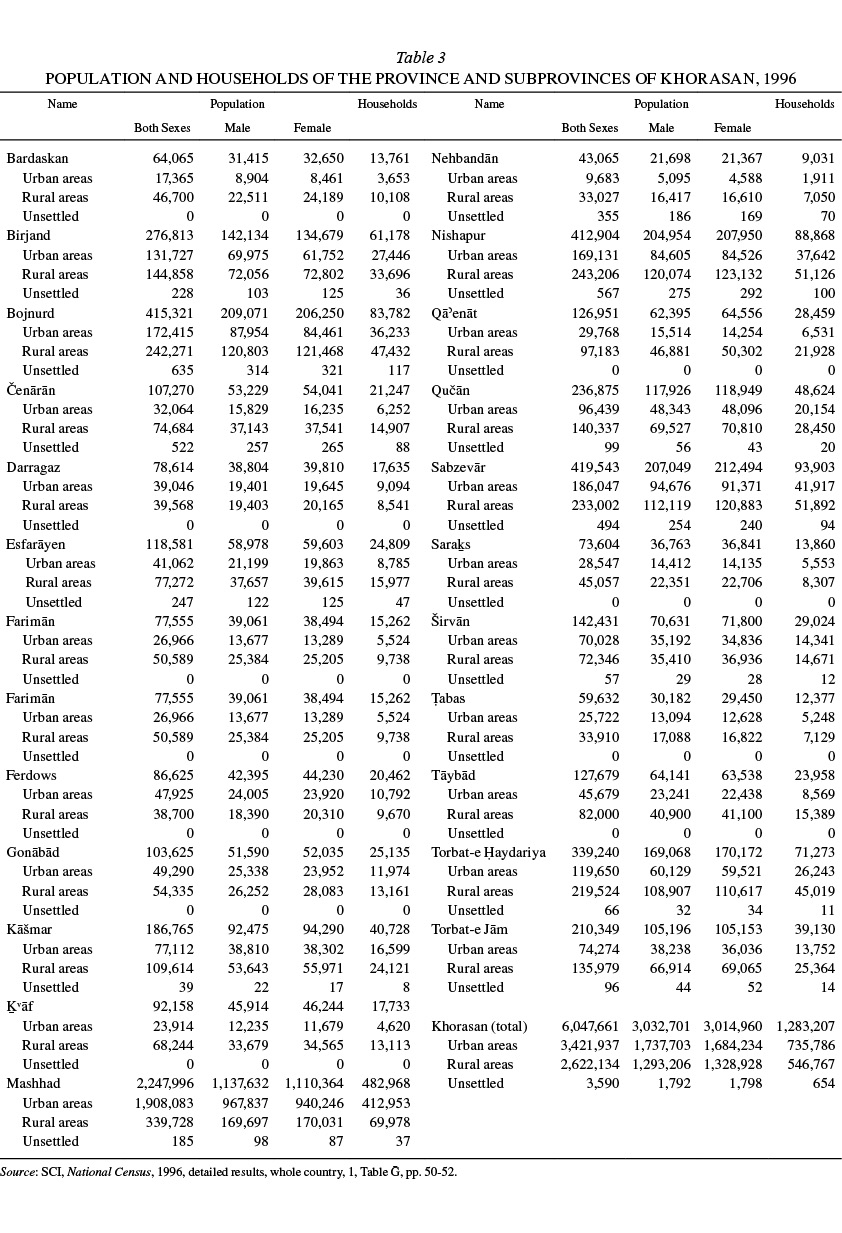
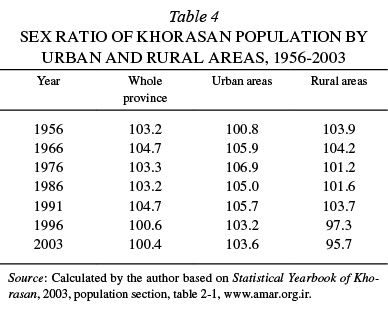
Sex and age structure of the population. Statistics on the population of Khorasan by gender may be found in Tables 3 and 4. The sex ratio of the population of Khorasan province and its urban and rural areas between 1956 and 2003 was slightly lower than the normal range. The trend in the changes in the sex ratio for the province was downward, starting from 103.2 in 1956 and declining to 100.6 in 2003. This trend was even faster in rural areas, where the sex ratio decreased from 103.9 in 1956 to 95.7 in 2003. This may be interpreted as a flow of out-migration of men from rural areas of the province during the years 1956-2003. In the urban areas, however, the trend is the opposite, as the sex ratio of the population increased from 100.8 in 1956 to 103.6 in 2003.
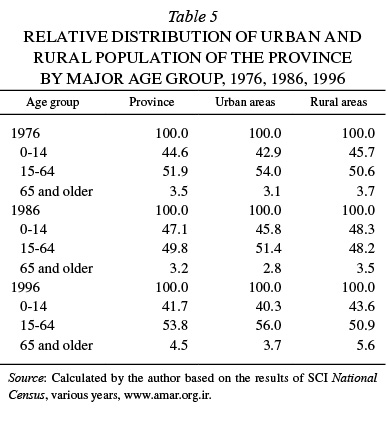
The figures in Table 5 are indicative of a relatively young population in the province, even in 1996, despite an aging trend (a decreased share of people aged 0-14 and a simultaneously increased share of people aged 65 and over) during the two decades 1976-96. The age distribution of population by major age groups for Khorasan province in 1996 is indicative of a transition from a youth to a middle age model.
Urban and rural population. From 1956 until 1991, the urbanization ratio of the province had always been less than 50 percent, but in 1991 the urban population exceeded the rural for the first time. In 2003, more than 60 percent of the population of Khorasan lived in the 86 cities of the province (Table 6).
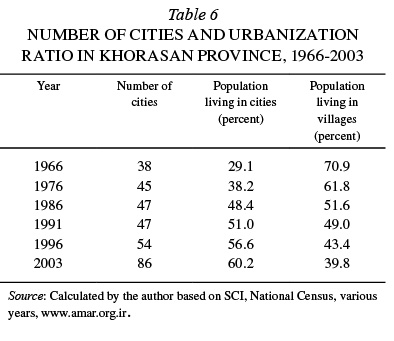
According to the figures presented in Table 6, the urbanization ratio of the province doubled over an almost four-decade period, which is similar to that for the country as a whole. In Khorasan, the average population of the cities was about 20,000 in 1966 and 27,500, 54,000, 63,000 and 47,000 for 1976, 1986, 1996, and 2003 respectively. The decrease in the average population of the cities in 2003 is due to the increased number of small cities between the years 1996 and 2003. In 1996, the cities of Khorasan had a wide range of population numbers, namely as low as only 645 people in the city of Bājgirān and as high as 1,887,405 in the city of Mashhad. In the same year, 81.5 percent of the cities combined had only 16.2 percent of the population, while 55.2 percent of the urban population of the province was located in only one city, the provincial capital of the province, Mashhad. In that year, Mashhad, as the largest city of the province, was 11 times as large as the second largest city of the province, i.e., Sabzevār, and its population alone (1,887,405 people) had 352,873 people more than the total population of the other 53 cities of the province. This phenomenon is referred to as single-city domination, and, as seen from this point of view, Khorasan had the most unbalanced situation among all the provinces of Iran. However, in 1996, the average population for cities in the province (63,369 people) was significantly higher than that for the country as a whole (59,963 people).
Migration status. During the period 1986-96, a total of 819,647 migrants arrived in the various areas of Khorasan province, of whom 449,891 were male and 369,756 were female (Table 7). The sex ratio of these immigrants was 122 males per 100 females, which cannot be considered a normal sex ratio and shows that the migration to the province was typically of men looking for work or university education, a rather short-term migration. Although the number of immigrants during this period of time (819,647 people) is equal to almost 13.6 percent of the total population of the province and shows a rate of around 1.4 percent per year, this does not mean that the population of Khorasan has been increasing by 1.4 percent per year due to migration. This is due to (1) the origin of migration and (2) out-migration from Khorasan to other provinces. Regarding the origin of migration, it should be noted that, out of 819,647 people who migrated to Khorasan, the origin of 634,498 of them (77.4 percent) was from the same province as the destination, Khorasan, which is called internal migration. Therefore, the number of people who moved to the province from outside of it was 185,149. Out-migration is also an important element. In the same period of time, 175,792 people left the province. Consequently, the net migration gain in the province was only 9,357 people.
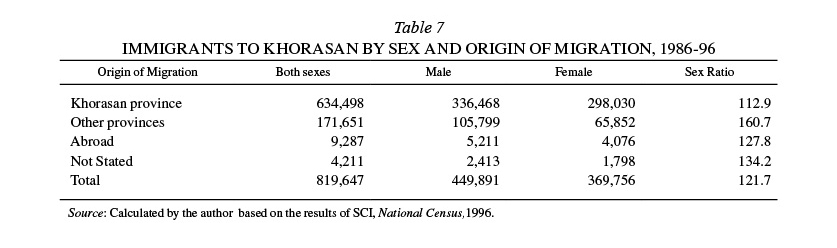
During the decennial interval 1986-96, Tehran province was the main province of origin for inter-provincial immigration to Khorasan; 57,737 persons (31.2 percent of immigrants) had moved to Khorasan from that province. Māzandarān, Sistān o Balučestān, and Ḵuzestān were the next three main provinces of origin, with 22,235 (12.0 percent), 21,965 (11.9 percent) and 11,223 (6.1 percent) respectively. In addition, 9,287 immigrants (5.0 percent) originated from abroad (calculated by the author from the results of SCI, National Census, 1996).
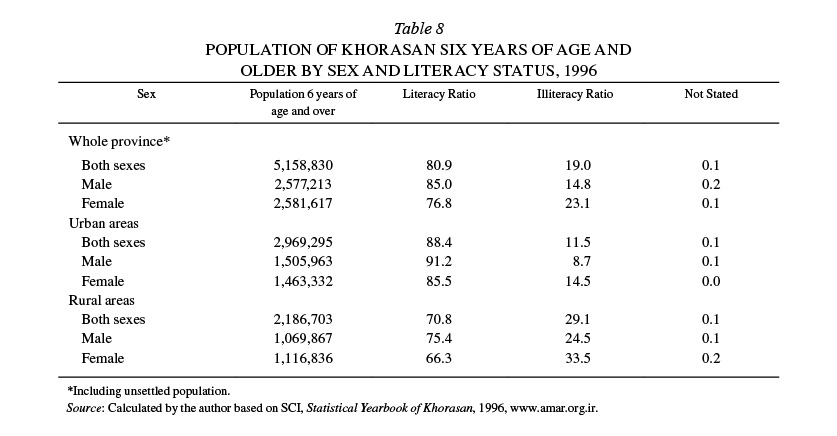
Literacy status. Based on the results of the 1996 national census, 5,158,830 people in Khorasan were 6 years of age and older, of whom 80.9 percent were literate, 19.0 percent illiterate, and the literacy status of 0.1 percent was not stated (Table 8). Literacy status among men and women was still significantly different. While the literacy ratio for men was 85.0 percent, the proportion of literate women was not more than 76.8 percent. This was more significant in rural areas, where the difference reached more than 9 points. In general, the highest literacy ratio belonged to urban males (91.2 percent), and the lowest was that for rural females (66.3 percent).
Households and housing. According to the results of the 1996 national census, out of 1,283,207 households in Khorasan province, 1,281,220 (99.9 percent) were ordinary, and the rest were unsettled households (Table 9). A tendency toward middle size households was clearly seen, so that the households with 3, 4, or 5 members made up 46.7 percent of total ordinary households. This ratio varied between urban and rural areas, being 51.6 percent in the former and 40.0 percent in the latter.
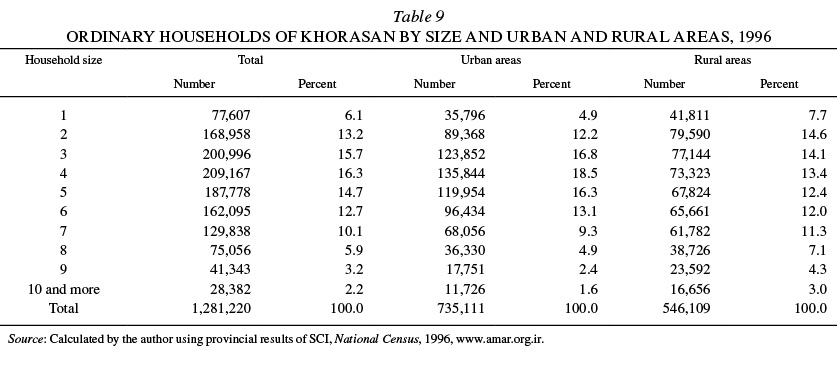
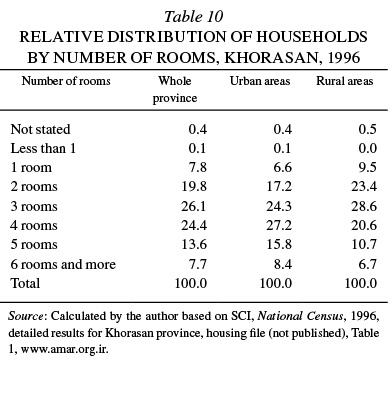
In 1996, all ordinary households of the Khorasan province (1,281,220 households) were living in 1,111,471 dwelling units, i.e., there was an average of 1.15 households per dwelling unit. The density of households per dwelling unit in urban areas of the province (1.18) was higher than that for rural areas (1.12). The relative distribution of these units according to the number of rooms is described in Table 10.
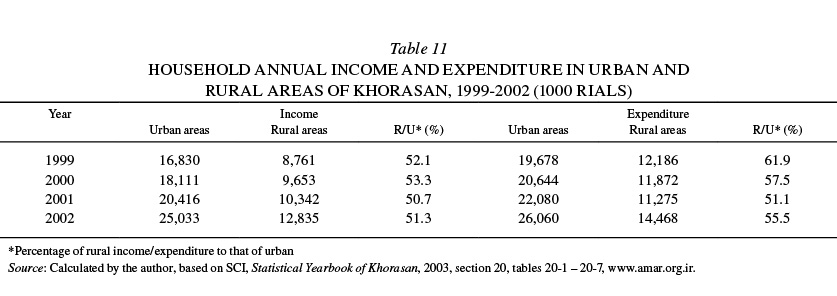
Household income and expenditure. Data on income and expenditure for urban and rural households in Khorasan is shown in Table 11. The contents of this table indicate that expenditures in both urban and rural areas were higher than income. This phenomenon, which is prevalent in many other provinces as well as in the country as a whole, probably results from not including some minor sources of income. The data can still be used, particularly as the discrepancy declines over time, but it should be remembered that the income total may be under-enumerated. Two main points may be noted regarding these figures. First, the percentage of rural income to that of urban, as an index of income gap between the two societies, shows that the income increase in rural areas was at least as fast as for urban areas. Second, the percentage of rural expenditure to urban expenditure was always higher than the same percentage for income, especially in 1999 (61.9 versus 52.1), which means that expenditure in rural areas was relatively higher than in urban areas. Moreover, there was no sign of a departure from this pattern, indicating that the balance between income and expenditure in rural areas was worse than that of urban areas and probably would not change in the near term.
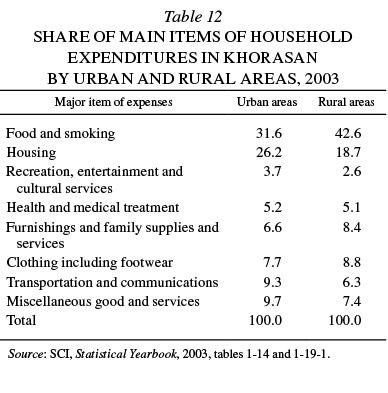
The relative share of major items of expenses in rural and urban areas of the province presented in Table 12 for 2003, the year before separation, shows different shares of expense items between rural and urban areas, but the wider discrepancies belong to food and smoking (31.6 percent in urban against 42.6 percent in rural areas) and housing (26.2 percent in urban against 18.7 percent in rural areas).
Activity status. According to the results of the 1996 national population census, 4,428,577 people (73.2 percent) of the total population of the province were 10 years of age and older, of whom 37.0 percent were economically active, 61.6 percent were economically inactive, and the other 1.4 percent had not stated their activity status. Employment ratio in the province was 93.0 percent (94.3 percent for men and 86.4 for women) and 7.0 percent were unemployed, looking for work (Table 13).
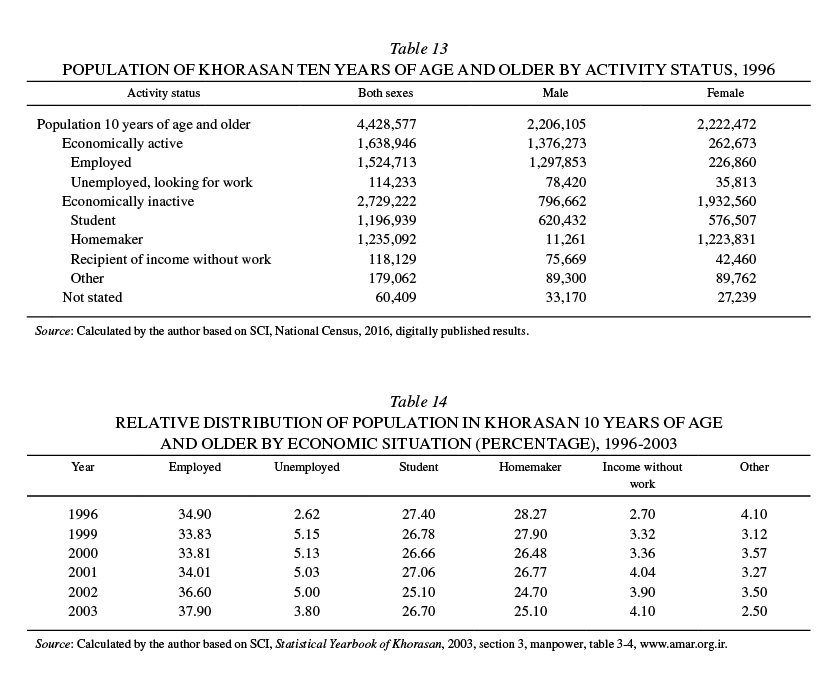
Most of the inactive population were homemakers (45.3 percent) and primarily women. Students were the second large subgroup (43.8 percent) and unlike homemakers were mostly men. Analysis of trends in the activity and unemployment ratios in this province during 1996-2003 leads to the figures presented in Table 14.
NORTH KHORASAN PROVINCE
General characteristics. North Khorasan was established as a separate province of Iran in 2004 as part of the division of the former Khorasan province into three new provinces. At the time of the 2016 national census, it had an area of 28,434 km2, and it consisted of 8 subprovinces, 19 districts, 45 subdistricts, 22 cities, and 840 occupied villages. The province is bounded by Turkmenistan on the north and northeast, by Razavi Khorasan on the east and south, by Semnān province on the south-west, and by Golestan province on the west.
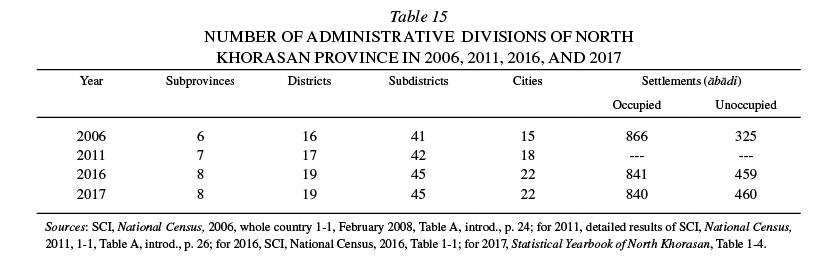
Internal administrative divisions. Since the province did not exist independently in the pre-2006 censuses, the number of internal divisions of the province from 2006 to 2017 is indicated in Table 15.
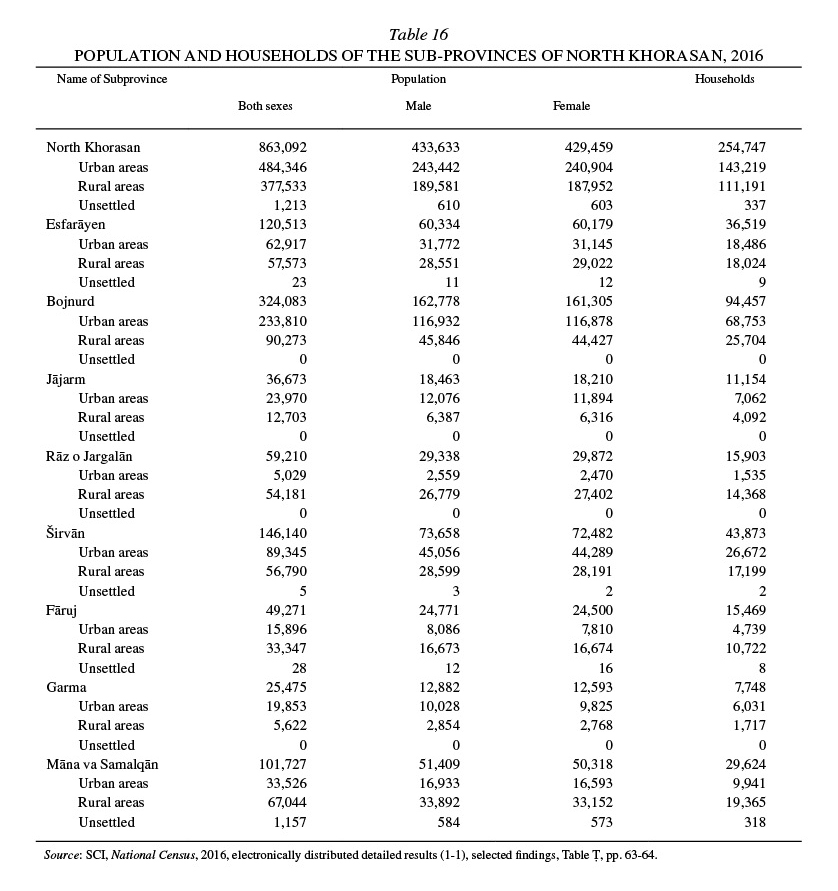
Population. Based on the results of the 2016 national census (Table 16), North Khorasan had a population of 863,092, distributed among 254,747 households. Given its area of 28,434 km2, the population density equaled 30 people per km2. Almost 56 percent of the population lived in urban areas, and the rest (44 percent) either lived in rural areas or were unsettled. In the same year, Bojnurd was the most populated subprovince with 37.5 percent of the province’s population, while the share of Garma subprovince was less than 3 percent. Five years earlier, for the 2011 census, the province had a population of 867,727, forming 241,180 households.
Although the province has only been in existence since 2004, the Statistical Center of Iran has population figures for it calculated from 1986 onwards (Table 17).
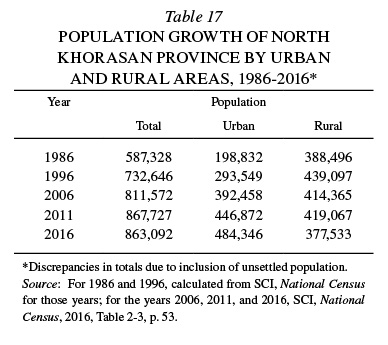
According to the figures in Table 17, it can be seen that the population growth rate for the province reached 2.24 percent per year in 1996. In general, the annual population growth rate in the province has always been decreasing. In 1996, almost 1.2 percent of the country’s population lived in North Khorasan, but during the ten-year period 1996-2006 the population growth rate of the province was less than that of the whole country, and consequently the share of the population of North Khorasan had been reduced to less than 1.1 percent.
Sex and age structure of the population. Sex ratio, i.e., the number of males per 100 females, in the population of the province and its urban and rural areas was considerably lower than the normal range and did not change very much during the years 2006 and 2011 (Table 18). This may be interpreted as a flow of out-migration of men, especially from rural areas of the province during those years. However, the effect of this flow of migration seemed to diminish during the five years of 2011-16 in terms of increasing sex ratios especially in the rural areas of the province, though still below the national norm (103).
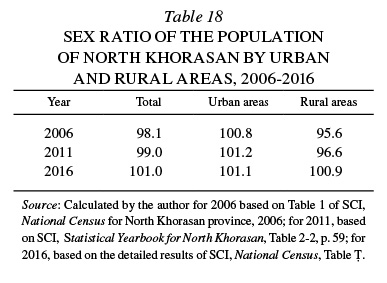
At the subprovince level, variation in this ratio in 2016 ranged between 98.2 in Rāz o Jargalān and 102.3 in Māna va Samalgan. A noteworthy point is in regard to urban areas, where the sex ratio for all subprovinces was more than 100, meaning that the number of men was more than that of women in all of them, although still under the normal range.
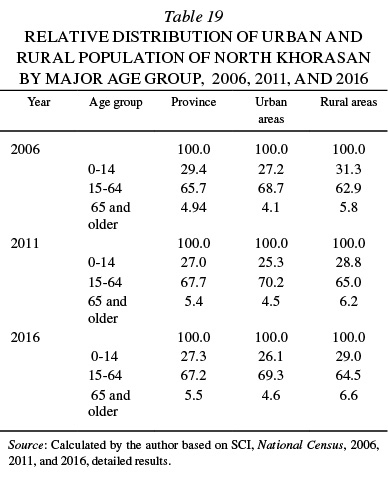
The age distribution of population by major age groups for North Khorasan province in 2016 (Table 19) is indicative of a stage of transition from the youth to the middle age model. According to the data in Table 19, the share of the population group aged 0-14 years, which was around 29 percent of the total population in 2006, had decreased to approximately 27 percent in 2011 and 2016. This can be interpreted as an indication of the beginning of population aging due to continuous low fertility rate.
Urban and rural population. Since 1986, the urbanization ratio of the population of North Khorasan province has been steadily increasing, and despite being as low as 33.9 percent in 1986, it was 56.2 percent in 2016 (Table 20).
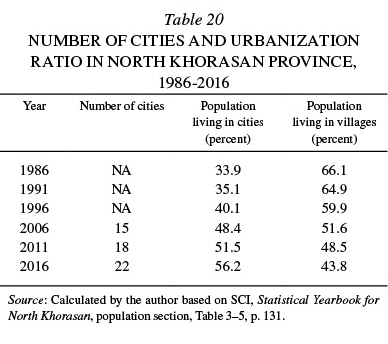
According to the figures presented in Table 20, the urbanization ratio of the province increased almost 14 percent in a period of 10 years, which is much faster than that for the country as a whole. In North Khorasan, the average population of the cities was 26,164 people for 2006; 24,826 for 2011; and 22,016 for 2016. There were many small cities in the province, so that in 2016, 64 percent of the cities had only 8.4 percent of the urban population, while 47.2 percent of the urban population of the province was located in only one city, the provincial capital, Bojnurd. In that year, Bojnurd, as the most highly populated city of the province, had a population 2.8 times greater than the population of the second most-populated city of the province, Širvān. Although it is not as obvious as in Razavi Khorasan and South Khorasan, North Khorasan could still be considered as dominated by a single city. However, in 2016, the average population of cities for the province (22,016 people) was significantly lower than that for the country as a whole (47,662 people).
Migration status. In the quinquennial period 2011-16, a total of 49,499 migrants arrived in the various areas of North Khorasan province or changed their place of residence inside the province. Of them, 24,956 were male and 24,543 were female. The sex ratio of these migrants is thus calculated as 101.7 males per 100 females. This sex ratio is very similar to that of the total population of the province and can be interpreted as largely due to family migration in North Khorasan. Although the number of immigrants during this period of time (49,499 people) is 5.7 percent of the total population of the province and shows a rate of around 1.15 percent per year, this does not mean that the population of North Khorasan is increasing by 1.15 percent per year due to the migration component. This can be explained by (1) the origin of migration and (2) out-migration from North Khorasan to other provinces. Regarding the origin of migration, it should be noted that out of 49,499 immigrants in North Khorasan, the origin of 27,703 (56.0 percent) was from the same province as the destination, North Khorasan; i.e., the result of what is called internal migration. Furthermore, 15,294 migrants (30.9 percent) did not even change the subprovince of their residence. Therefore, the number of people who moved into the province from outside is 21,799 people (49,499 – 27,703; Table 21). As for the second factor, that is, out-migration from North Khorasan, it should be noted that in the same period of time, 36,950 people left the province. Consequently, the net migration in the province was -15,151 people.
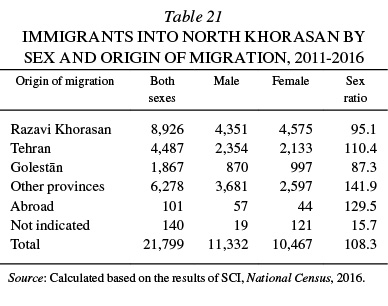
During the period 2011-16, Razavi Khorasan province was the main origin for inter-provincial immigration to North Khorasan, as 8,926 people (40.9 percent) came from that province. The provinces of Tehran and Golestan were the next two main origins, with 4,487 people (20.6 percent) and 1,867 people (8.6 percent) accordingly. Thus, these three provinces were the source of more than 71 percent of the inter-provincial immigrants to North Khorasan. Razavi Khorasan was not only the main origin of inter-provincial immigration to North Khorasan but also the main destination for migration from the province. From 2011-16, a total of 12,820 people (34.7 percent) migrated from North Khorasan to Razavi Khorasan province. The city of Mashhad alone, the capital of that province, was the destination for 10,040 migrants (27.2 percent) from North Khorasan. The provinces of Tehran, with 11,710 (31.7 percent); Māzandarān, with 2,628 (7.1 percent); and Golestān, with 1,863 (5.0 percent), were ranked the next three provinces for emigration from North Khorasan.
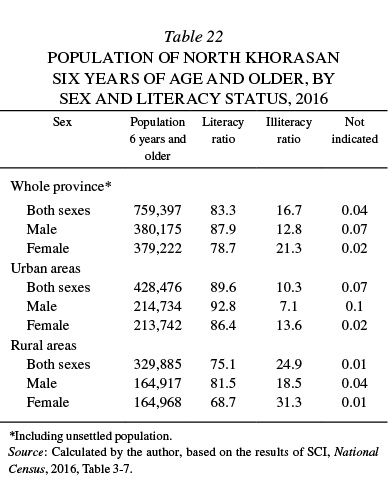
Literacy status. According to the results of the 2016 national census, 759,397 people in North Khorasan were 6 years of age and older, of whom 83.3 percent were literate, 16.7 percent were illiterate, and the literacy status of 0.04 percent was not indicated (Table 22). Literacy status among men and women was significantly different: The literacy ratio for men was close to 88 percent, while the proportion of literate women was not more than 78.7 percent. This was more significant in rural areas, where the difference reached nearly 13 points. Generally, the highest literacy ratio belonged to urban males (92.8 percent) and the lowest to rural females (68.7 percent).
There are also some important points regarding the level of education. As reflected in the results of the 2016 national census, the elementary enrollment ratio in the province (30.6 percent) is almost the same for males (30.8 percent) and females (30.3 percent). But in secondary school (both in pre-diploma and high school diploma), the enrollment ratio for female students is significantly lower than that for male students, which can be interpreted as a higher educational decrement among female students in the province. This is also true for the higher education level, even though the difference is not as much (Table 23).

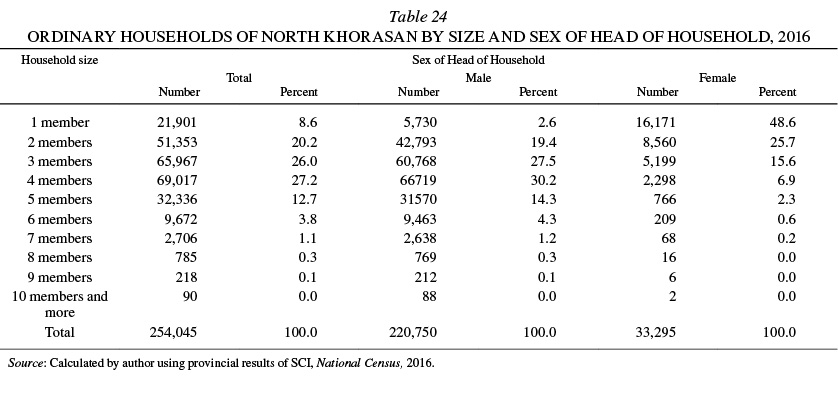
Households and housing. Of 254,747 households in North Khorasan province, 254,045 (99.7 percent) were ordinary settled households and the rest were institutional or unsettled households, according to the results of the 2016 national census (Table 24). Given the low number of large households with more than 5 members (5.3 percent), a tendency toward smaller households is clearly seen, in that households with 2, 3, or 4 members comprised 73.4 percent of total ordinary households.
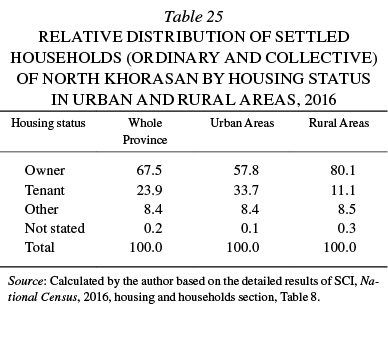
As shown in Table 25, the typical status of housing in the rural areas of North Khorasan is ownership, as more than 80 percent of households own their place of residence and only 11 percent are tenants. In the urban areas, however, more than one third (33.7 percent) are tenants, although 57.8 percent are also owners of their place of residence.
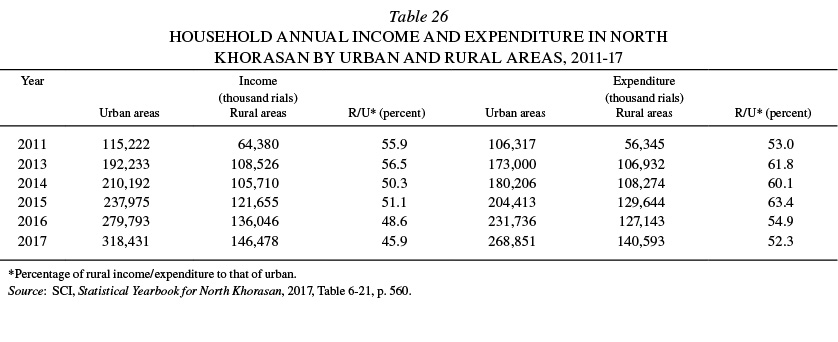
Household income and expenditure. Data on income and expenditure for urban and rural households of North Khorasan is shown in Table 26. Contents of this table show that rural expenditures were higher than income in 2014 and 2015. This phenomenon, which is prevalent in many other provinces as well as in the country as a whole, probably happens as the result of not counting some minor source of income, which should be kept in mind when using the data. Two main points are noteworthy: (1) The percentage of rural income to that of urban, as an index of income gap between the two societies, despite some fluctuation, decreased from 56.5 percent in 2013 to 45.9 percent in 2017. (2) The percentage of rural expenditure to urban expenditure is often higher than the same percentage for income, especially in 2014, when it was 60.1 per cent against 50.3 percent, meaning that the cost of living in rural areas was growing relatively faster than in urban areas.
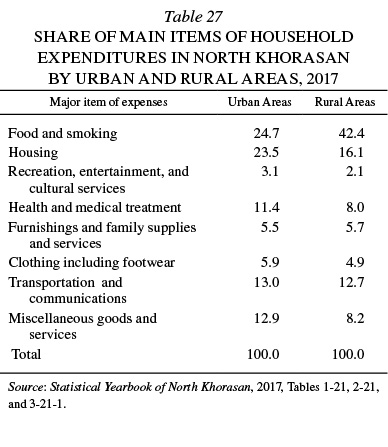
The relative share of major items of expenses in the rural and urban areas of North Khorasan for the year 2017, presented in Table 27, shows a different share of expense items between the rural and urban areas, in which the greatest discrepancies belong to food and smoking items (24.7 percent in the urban against 42.4 percent in the rural areas) and housing (23.5 percent in the urban against 16.1 percent in the rural areas).
Activity status. According to the results of the 2016 National Census, 695,821 people (80.62 percent) of the total population of North Khorasan, were 10 years of age and older, of whom 40.5 percent were economically active, 59.2 percent were economically inactive, and the other 0.3 percent did not state their activity status (Table 28). The employment ratio in the province was 87.9 percent (89.3 percent for men and 81.4 for women) and 12.1 percent were unemployed and looking for work.
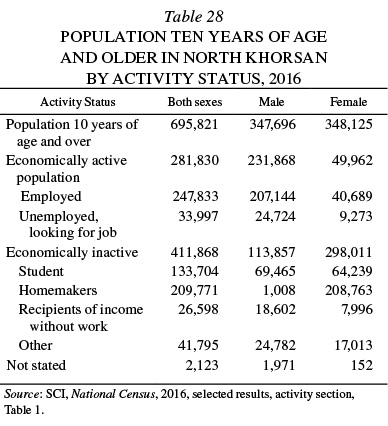
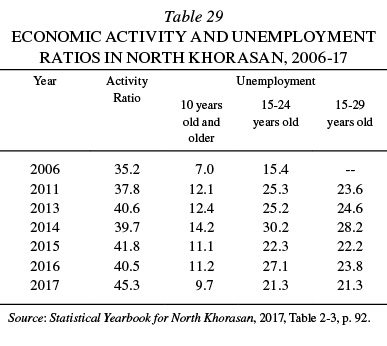
Most of the inactive population were homemakers (50.9 percent) and mostly women. Students were the second largest subgroup (32.5 percent), and unlike homemakers they were mostly men. An analysis of the trend of activity and unemployment ratios in North Khorasan from 2006 to 2017 yields the results in Table 29.
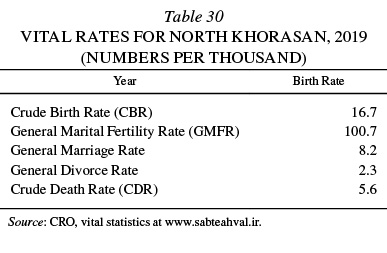
Fertility and mortality. Vital rates and changes in the number of births and deaths in North Khorasan province in 2019 are shown in Tables 30 and 31.
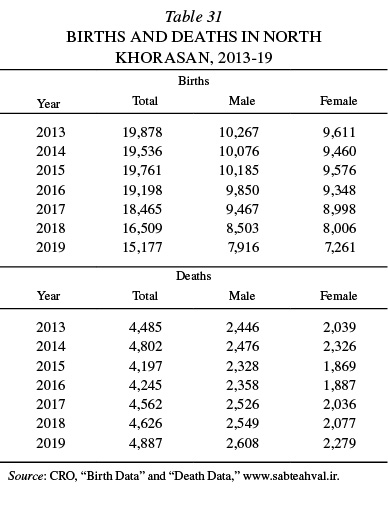
It should be noted that registration of births has become highly desirable in recent years due to economic subsidies for each birth, while the registration of deaths is not fully covered yet. National birth registration coverage was announced as 94.7 percent during the same calendar year as the birth occurrence, and 96.8 percent before the end of the year after birth (CRO, Yearbook 1391 Š./2013, p. 168).
As for causes of death, the highest number of deaths in 2019 was from cardiovascular diseases (1,871 cases), followed by cancer and neoplasms (616 cases), and respiratory diseases (606 cases) (CRO, Vital Statistics Yearly Summary, 2019, table 8). The decreasing number of births for both sexes, a trend of concern noted by demographers across Iran, is clearly observable in North Khorasan.
RAZAVI KHORASAN PROVINCE
General characteristics. When Razavi Khorasan was established as a province in 2004, it had an area of approximately 116,000 km2 (2017 statistical yearbook for the province, Table 2-1, p. 32). In 2006, in the first national census after the formation of the province, Razavi Khorasan had 19 subprovinces, 62 districts, 66 cities, 3,627 occupied villages, and a total of 7,389 villages (occupied and non-occupied), and an area of 125,832 km2 (SCI, National Census, 1387 Š./2006). At the time of the 2016 national census, it had an area of 118,851 km2 and consisted of 28 subprovinces, 70 districts, 164 subdistricts, and 3,281 occupied villages. Razavi Khorasan province is bounded by Turkmenistan to the north; by Afghanistan to the east; by North Khorasan to the northwest; by Semnān province to the west, and by South Khorasan province to the south.
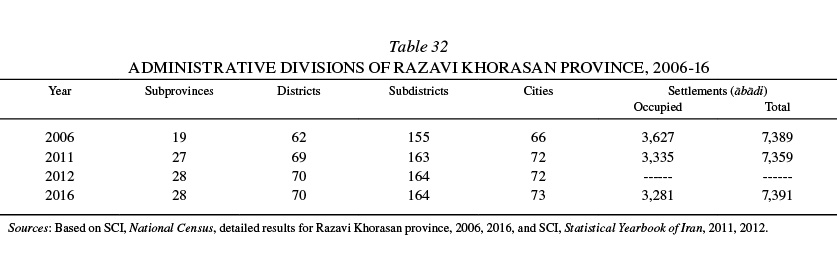
Internal administrative divisions. The number of administrative divisions of Razavi Khorasan as indicated in census data for the years after its establishment is found in Table 32. After 2011, the main change has been a decrease in the number of occupied villages and an increase in unoccupied ones.
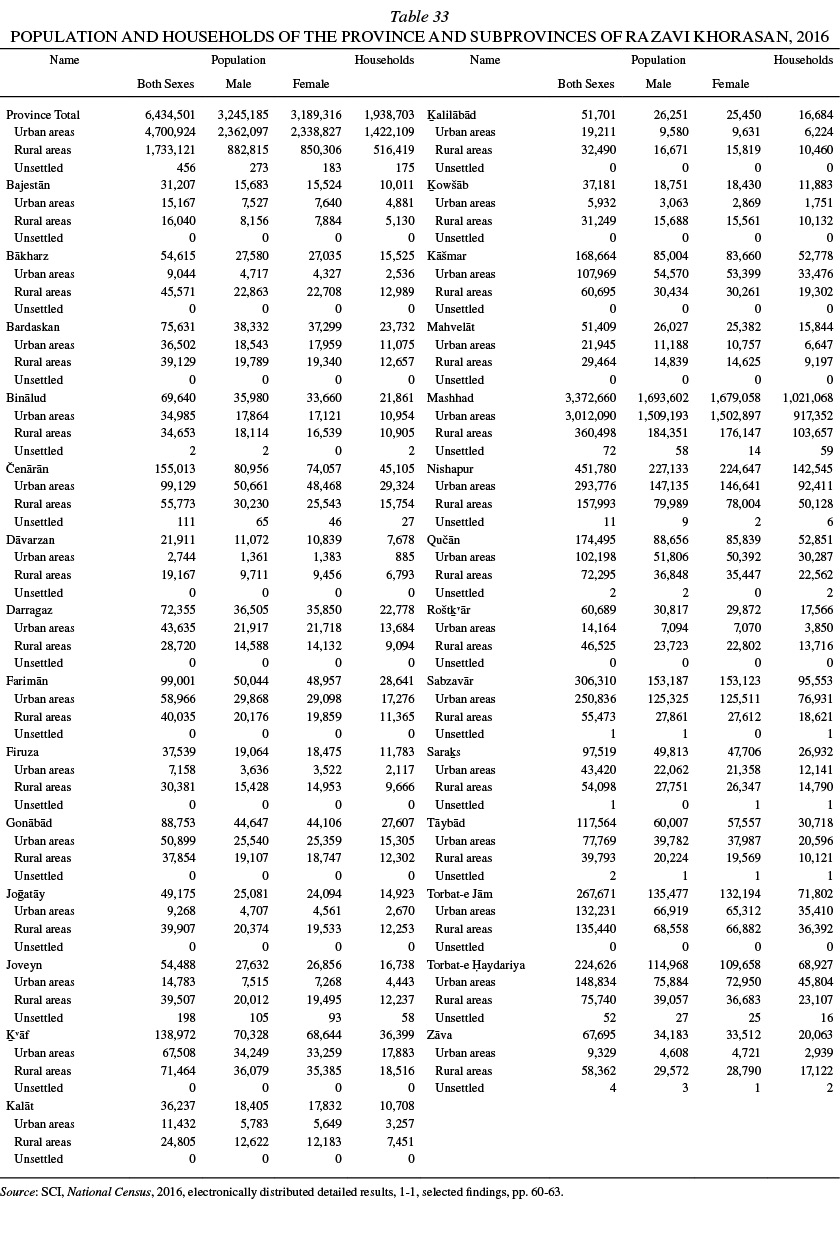
Population. Based on the results of the 2016 national census, Razavi Khorasan province had a population of 6,434,501 people in 1,938,703 households. The population in 2016 for each subprovince, by sex and urban and rural areas is given in Table 33. Given its area of 118,851 km2, the population density for 2016 can be calculated as 54.5 people per km2. Close to three quarters (73.1 percent) of the population lived in urban areas and less than 27 percent of the population lived in the rural areas.
Five years earlier, in 2011, the province had a population of 5,994,402, forming 1,717,262 households. The density of population was 51.6 people per km2, and 71.9 percent of the population of the province were living in urban areas. Although the province was only established in 2004, the Statistical Center of Iran has calculated its population for 1986 onwards as shown in Table 34.
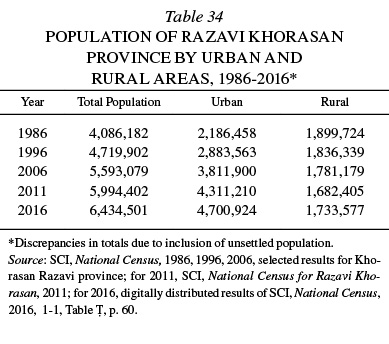
According to the figures in Table 34, the average annual population growth rate in the first ten-year period was 1.45 percent (-.32 percent in the rural and 2.81 percent in the urban areas). In the second ten-year period, it was 1.71 percent (-0.30 percent in the rural and 2.83 percent in the urban areas). In the third decade (2006-11), it was 1.40 percent (-1.15 percent in the rural and 2.49 percent in the urban areas). Finally, in the last five-year period (2011-16), it was 1.43 percent (0.6 percent in the rural and 1.75 percent in the urban areas). It may be observed that, for the first time since 1986, the population growth rate for the rural areas of the province was greater than zero.
Sex and age structure of the population. Changes in sex ratio in the population of Razavi Khorasan and its urban and rural areas between 2006 and 2011 were very low and, in general, slightly lower than the normal range (Table 35). This may be interpreted as a flow of out-migration of men, especially from rural areas of the province during those years. However, this flow of migration decreased over the next five years (2011-16) in terms of increasing sex ratios, especially in the rural areas of the province. At the subprovince level, changes in this ratio in 2016 ranged from 100.0 in Sabzavār to 109.3 in Čenārān.
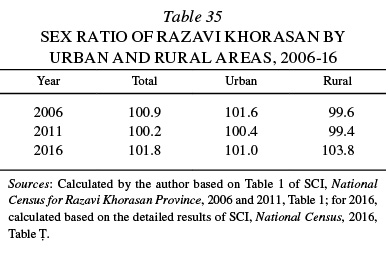
In Table 35, a tendency toward a higher sex ratio in rural areas compared to that of urban areas is clearly observable; this can be interpreted as a result of a flow of out-migration of men from urban areas in recent years.
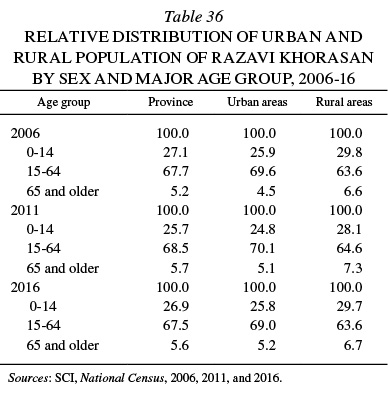
The age distribution of population by major age groups for Razavi Khorasan province in 2016 (Table 36) indicates a stage of transition from the youth to the middle age model. The figures in Table 36 indicate a relative decrease in the young population and an increase in the aging population, which is caused by decreased fertility levels and increased life expectancy, gradually pushing the population into middle age and then aging.
Urban and rural population. Since 1986, the urbanization ratio of the population of the province has always been more than 50 percent, and in 2016 in particular more than 73 percent of the population lived in urban areas (Table 37). Therefore, it can be said that this province has an urbanized character, although a large number of its cities are not highly populated.
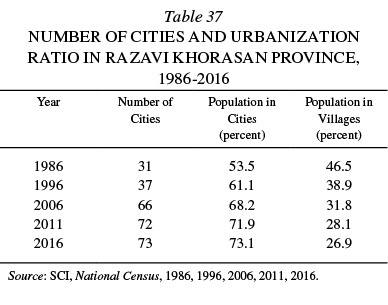
According to figures presented in Table 37, the urbanization ratio of the province has increased almost 40 percent (39.2) over a three-decade period, which is very similar to that for the country as a whole. In Razavi Khorasan, the average population of the cities was 70,530 people in 1986; 77,934 in 1996; 57,756 in 2006; 59,880 in 2011; and 64,396 in 2016. In 2016, more than three quarters (78 percent) of the cities had only 7 percent of the urban population, while 63.8 percent of the urban population of the province was located in only one city, the provincial capital, Mashhad. In that year, Mashhad was 12.3 times as large as the next largest city in the province, i.e., Nishapur, and its population alone (3,001,184) was 1,285,000 more than the total population of the other 72 cities of the province. This phenomenon is referred to as single-city domination, and in this respect Razavi Khorasan had the most unbalanced situation among all the provinces of Iran. However, in 2016, the average population of cities for Razavi Khorasan (64,396 people) was significantly higher than that of the country as a whole (47,622 people), and this situation was also true for the average population of villages in this province (504 against 363 for the country).
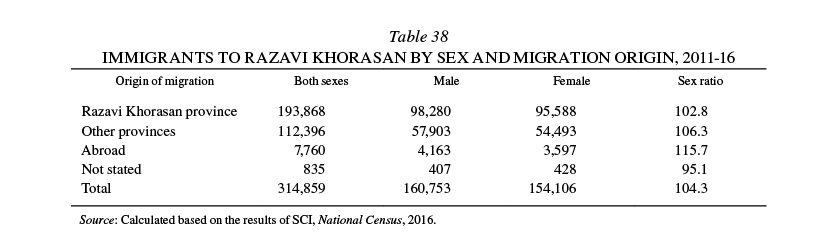
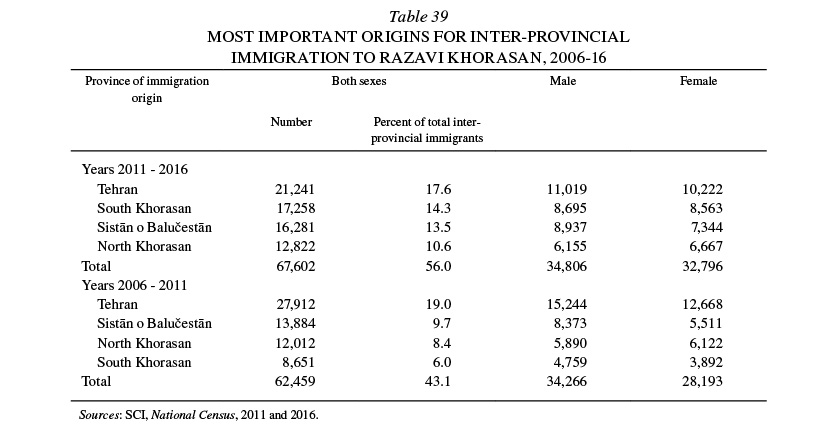
Migration status. During the period 2011-16, a total of 314,859 migrants arrived in the different areas of Razavi Khorasan province, of whom 160,753 were male and 154,106 were female (Table 38). The sex ratio of these migrants is calculated to be 104.3 males per 100 females, which can be considered a normal sex ratio. This indicates that migration to the province is typically family migration, which tends to be rather long-term migration. Although the number of immigrants during this period of time (314,859 people) was equal to almost 5 percent (4.9 percent) of the total population of the province and shows a rate of around 1 percent per year, this does not imply that the population of Razavi Khorasan was increasing by 1 percent per year due to migration. As with other provinces, this can be attributed to (1) the origin of migration and (2) out-migration from Razavi Khorasan to other provinces. Regarding the origin of migration (Table 39), it should be noted that, out of 314,859 people who migrated to various subprovinces, the origin of 193,868 people (62 percent) was the same as the province of the destination, Razavi Khorasan; this is called internal migration. Therefore, the number of people who moved into the province from outside of it equals 120,991 (314,859 – 193,868) people. During the quinquennial interval of 2011-16, Tehran province was the main province of origin for inter-provincial immigration to Razavi Khorasan, as 21,241 people (17.6 percent of immigrants) moved from there (Table 39). South Khorasan, Sistān o Balučestān, and North Khorasan were the next three main provinces of origin with 17,258 (14.3 percent), 16,281 (13.5 percent) and 12,822 (10.6 percent) accordingly. This was also true for the previous quinquennial interval of 2006-11, apart from the ranking of the last three provinces.
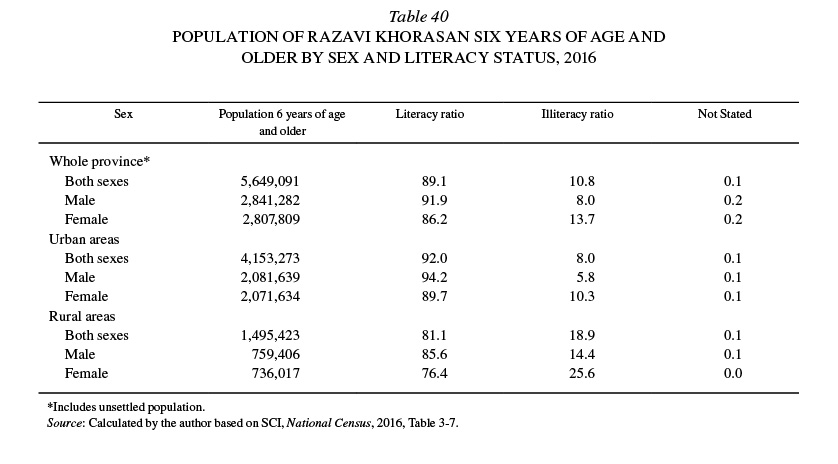
Literacy status. Based on the results of the 2016 national census, 5,649,091 people in Razavi Khorasan were 6 years of age and older, of whom 89.1 percent were literate, 10.8 percent illiterate, and the literacy status of 0.1 percent was not stated (Table 40). Literacy status among men and women is still significantly different: While the literacy ratio for men is close to 92 percent, the proportion of literate women is not more than 86.2 percent. This is more significant in rural areas, where the difference reaches almost 10 points. In general, the highest literacy ratio belongs to urban males (94.2 percent) and the lowest to rural females (76.4 percent).
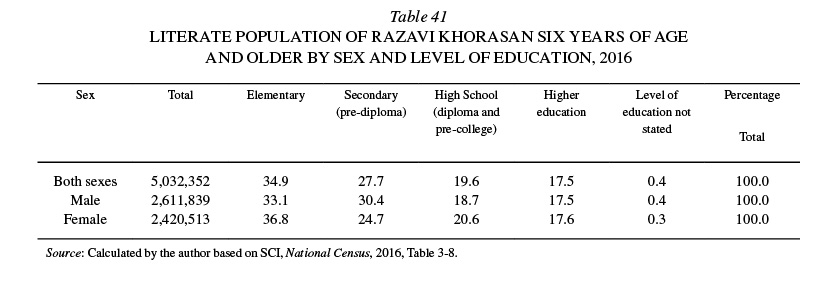
There are important points to note regarding the level of education. Based on the results of the 2016 national census, the female educational enrollment rate in the province (36.8 percent) was higher than male enrollment (33.1 percent). But in secondary school, conversely, the enrollment rate for female students was significantly lower than that of male students, which can be interpreted as a higher decrement of female students in the province. However, at the higher education level, the enrollment for both sexes was more or less the same, or even slightly more for female students (17.6 percent versus 17.5 percent; Table 41).
Households and housing. Of the 1,938,703 households in Razavi Khorasan province, 1,934,824 (99.8 percent) were ordinary and the rest were institutional or collective households, according to the results of the 2016 national census (Table 42). A tendency toward smaller households was clearly seen, so that households with 2, 3, or 4 members included 75.5 percent of the total ordinary households. This was different among households headed by a man and those headed by a woman, the former being four-member households (31.6 percent), while the latter were single-member households (46.4 percent).

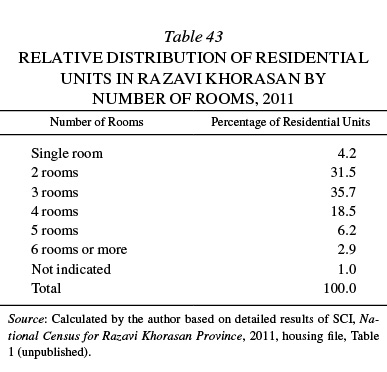
Of the total of 1,651,392 ordinary housing units in 2011, about 28.4 percent were apartment units and 71.6 percent were non-apartment units. The relative distribution of these units according to the number of rooms is described in Table 43.
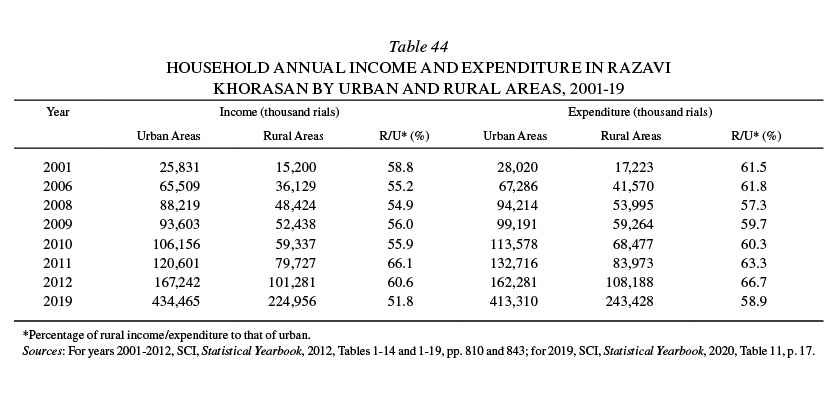
Household income and expenditure. Data on income and expenditure for urban and rural households of Razavi Khorasan is shown in Table 44. The contents of this table show that, in most years, expenditures were higher than income. This phenomenon, which is prevalent in many other provinces as well as in the country as a whole, is likely due to not counting some minor source of income. This should be kept in mind when using the data. Two main points are noteworthy in these figures: (1) The percentage of rural income to that of urban, as an index of income gap between the two societies, shows that the income increase in rural areas was not as fast as that for urban areas, especially in the recent decade (2011-19), during which the percentage of rural income to that of urban decreased from 66.1 percent in 2011 to 51.8 percent in 2019. (2) The percentage of rural expenditure to urban expenditure was usually higher than the same percentage for income, especially in 2019 (58.9 versus 51.8), which means expenditure in rural areas is relatively higher than in urban areas. Moreover, it was an increasing trend, indicating that the balance between income and expenditure in rural areas was worse than that for urban areas and probably will not change in the near term.
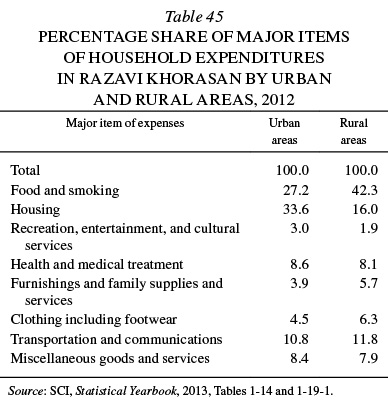
The relative share of major items of expenses in rural and urban areas of the province for the year 2012 as presented in Table 45 shows a different share of expense items between rural and urban areas, but the widest discrepancies belong to food and smoking (27.2 percent in urban versus 42.3 percent in rural areas) and housing (33.6 percent in urban against 16.0 percent in rural areas).
Activity status. According to the results of the 2016 national census, 5,202,145 people (80.85 percent) of the total population of Razavi Khorasan were 10 years of age and older, of whom 39.7 percent were economically active, 59.8 percent were economically inactive, and 0.5 percent had not indicated their activity status. The employment ratio in the province of those economnically active was 88.8 percent (89.9 percent for men and 82.5 percent for women); 11.2 percent were unemployed and looking for work (Table 46).
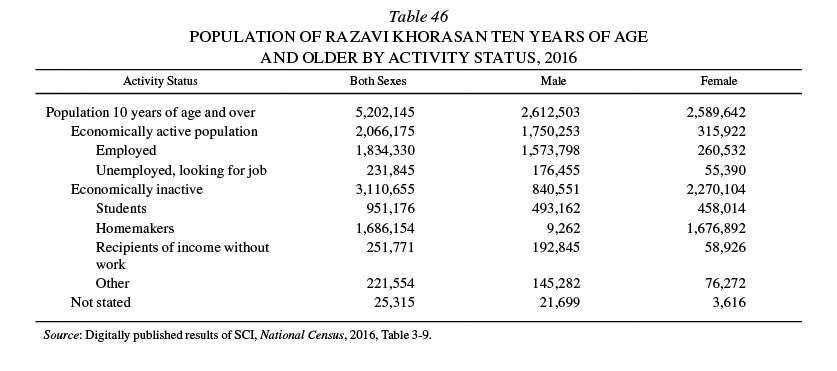
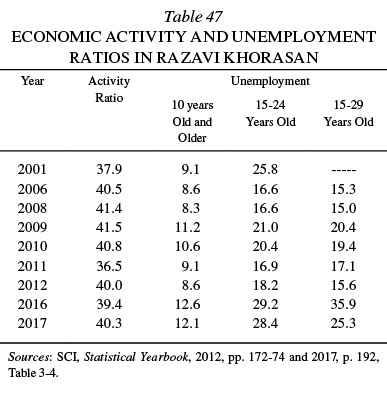
Most of the inactive population were homemakers (54.2 percent) and mostly women. Students were the second largest subgroup (30.6 percent) and unlike homemakers were mostly men. An analysis of the trend of activity and unemployment ratios in Razavi Khorasan, 2001-17 yields the results in Table 47.
Fertility and mortality. Changes in the number of births and deaths in Razavi Khorasan province are given in Tables 48 and 49.

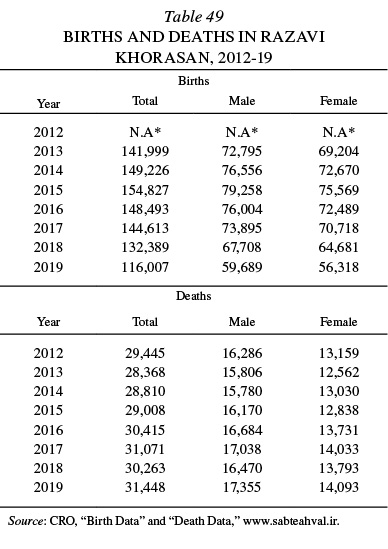
As in other provinces, registration of births in recent years has become highly desirable due to the economic subsidies for each birth, while the registration of deaths is not yet fully covered. The birth registration coverage was announced as 94.7 percent during the same calendar year as the birth and 96.8 percent by the end of the calendar year after birth (CRO, Yearbook, 1391 Š./2012, p. 168). A decreasing number of births, a trend in most areas of Iran, is clearly seen in Razavi Khorasan as well.
As for causes of death, in 2019 the highest number of deaths were due to cardiovascular diseases (11,235), followed by cancer and neoplasms (4,016 cases), respiratory disease (3,825 cases), ill-defined conditions (2,572 cases), accidents (2,045 cases), and unknown causes (1,287 cases) (CRO, Vital Statistics Yearly Summary, 2019, table 8).
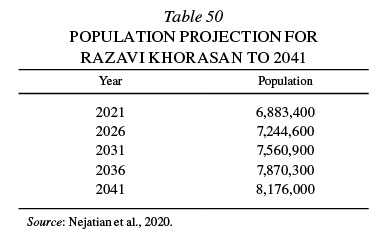
Population projection. The most recent projection for the population of Razavi Khorasan province is one done as a part of the large project on “Water Transmission to the Center of the Iranian Plateau from the Persian Gulf” (Nejatian et al., 2020). According to the findings of this study, the population of the province is estimated to be 8,449,800 in 2046; details for other years are found in Table 50.
SOUTH KHORASAN PROVINCE
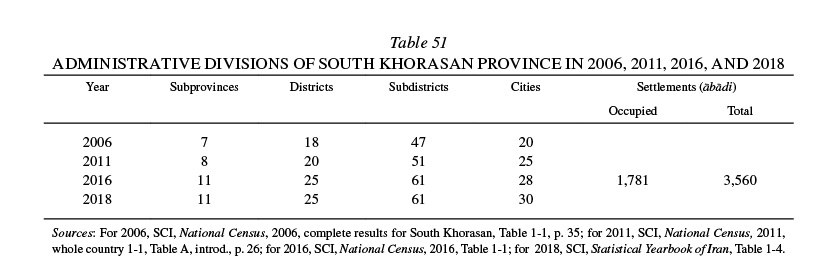
General characteristics. South Khorasan was created as an independent province in 2004 as part of the division of the former Khorasan province into three new provinces. The boundaries of the province have fluctuated, with Ferdows subprovince added in 2007 and Ṭabas subprovince in 2013. When created, it had an area of approximately 69,555 km2;; in 2011, the area was 95,385 km2; and at the time of the 2016 national census, South Khorasan had an area of 150,797 km2 (9.2 percent of the total area of Iran, making it the third largest of all provinces). In the 2006 national census, the first after the formation of the province, South Khorasan had 7 subprovinces, 18 districts, 47 subdistricts, and 20 cities. At the time of the 2016 census, it comprised 11 subprovinces, 25 districts, 61 subdistricts, 28 cities, 1,781 occupied villages, and a total of 3,560 villages (occupied and non-occupied). In 2017, just a year after the census, the number of cities in the subprovinces of both Sarbiša and Zirkuh increased from two to three and consequently, the total number of cities in the province rose to thirty (see Table 51). South Khorasan is bordered by Razavi Khorasan to the north, by Afghanistan to the east, by Sistān o Balučestān and Kerman provinces to the south, and by Yazd, Isfahan, and Semnān provinces to the west.
Population. Based on the results of the 2016 national census, the population of South Khorasan was 768,898, comprising 223,984 households. Given the area of 150,797 km2, the population density was as low as 5 people per km2. Almost 59 percent of the population lived in urban areas and the rest (41 percent) were either living in rural areas or were unsettled. In that same year (2016), Birjand subprovince was the most populated area, with a population density that reached as high as 65 persons per km2, while in Ṭabas subprovince, there was a density of only 1 person per km2. The population details for the province and each subprovince, by sex and urban and rural areas, are given in Table 52.

Although the province has only existed since 2004, the Statistical Center of Iran has calculated its population for years from 1986 onwards (Table 53). However, when using that data, especially in comparing the population of various years, attention should be given to the many changes in the province’s administrative divisions; for example, after the census of 2006 Ṭabas subprovince was separated from South Khorasan and annexed to Yazd province, but following the 2011 census it was reunited with South Khorasan (Nejatian et al., 2020). Therefore, the reported population for these years differ from those of the related census results.
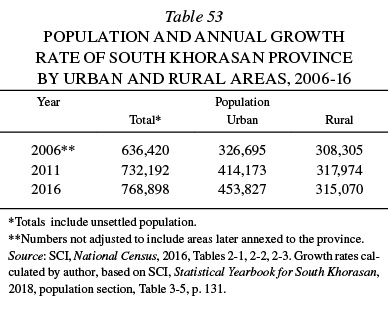
According to the figures in Table 53, it can be observed that, for the first time since 1986, the population growth rate for the rural areas of the province was less than zero. Generally speaking, in 1996 approximately 1 percent of the country’s population lived in South Khorasan. During the period 1996–2006, the population growth rate of the province was almost the same as that for the whole country, and consequently the province’s share of the country’s population also remained around 1 percent. But after 2006, the population of the province grew less than that of the whole country and, as a result, the share of the province’s population in the country was reduced to 0.97 in 2011 and to 0.96 in 2016 (Nejatian et al., 2020, p. 22).
In 2016, Ṭabas subprovince, with an area of 55,412 km2, covered more than one third (36.7 percent) of the total area of the province, while Birjand subprovince, with a population of 261,324, formed more than one-third (34.0 percent) of the population of the province.
Sex and age structure. Changes in the sex ratio of the population of the province and its urban and rural areas between 2006 and 2011 were very low and, in general, slightly lower than the normal range (Table 54). This may be interpreted as a flow of out-migration of men, especially from rural areas of the province during those years. However, the effect of this flow of migration seems to have been reduced during the period 2011-16, with increasing sex ratios, especially in the rural areas of the province.
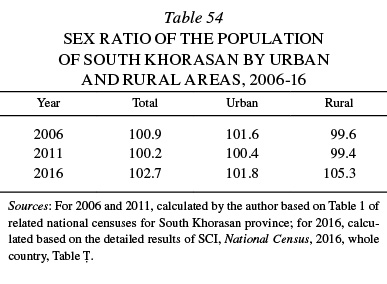
At the subprovince level, changes in this ratio in 2016 ranged from 99.2 in Sarbiša to 104.4 in Nehbandān, with an exception, of course, for Ḵusf subprovince with an unusual sex ratio of 130.9, which can be attributed to migration of single Afghan men to this subprovince and their forming collective households in this area. The trend is particularly noticable in the urban areas of Ḵusf subprovince, where the sex ratio was as high as 217.07, making it an overwhelmingly male-populated area.
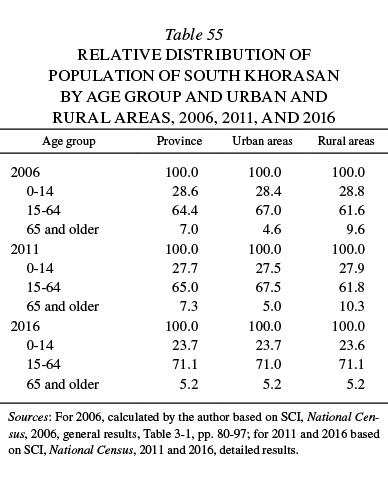
The age distribution of the population by major age group for South Khorasan province in 2016, shown in Table 55, is indicative of a stage of transition from the youth to the middle age model. The share of the 0-14 age group in the total population, which was around 28 percent in 2006, decreased to around 27 percent in 2011, and continued to decrease to approximately 23 percent in 2016. This can be interpreted as a sign of the beginning of population aging due to continuous low fertility in the province. In 2016, the average age of the population in South Khorasan was 29.5 years (male, 29.1; female, 29.90), and the median age was 27.0 (26.0 for males; 28.0 for females).
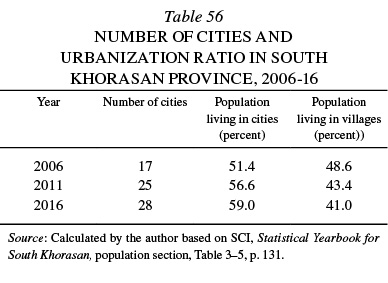
Urban and rural population. Since 1986, the urbanization ratio of the population of the South Khorasan province has always been more than 50 percent; in 2016, 59 percent of the population lived in urban areas. Therefore, it can be said that this province has an urban character, although a large number of its cities are not highly populated.
As shown in Table 56, the urbanization ratio of the province increased almost 15 percent over a period of 10 years, which is much faster than that for the country as a whole. In South Khorasan, the average population of the cities was 19,217 people for 2006; 16,567 for 2011; and 16,208 for 2016. In 2016, more than 56 percent of the cities had only 23.7 percent of the urban population, while 44.9 percent of the urban population of the province was located in only one city, the provincial capital Birjand. In that year, Birjand, as the main city of the province, was 3.4 times as large as Qāʾenāt, the second largest city of the province. Although it is not so obvious as in the case of Razavi Khorasan, South Khorasan can nonetheless be considered as dominated by a single-city. However, in 2016, the average population of cities for the province (16,208 people) was significantly lower than that for the country (47,622 people).
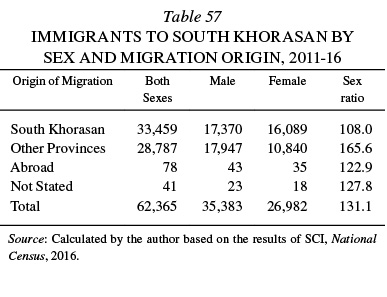
Migration status. During the period 2011-16, a total of 62,365 migrants arrived in the various areas of South Khorasan province or changed their place of residence inside the province; of them, 35,383 were male and 26,982 were female (Table 57). The sex ratio of these migrants is calculated to be 131.1 males per 100 females. Although this sex ratio would be too high in a normal society, it is not unusual among migrants, especially among non-family migrants. Although the number of immigrants during this period of time (62,365 people) is more than 8 percent of the total population of the province and shows a rate of around 1.6 percent per year, this does not mean that the population of South Khorasan is increasing by 1.6 percent per year due to migration. This is attributable to (1) the origin of migration and (2) out-migration from South Khorasan to other provinces. Regarding origin of migration, it should be noted that, out of 62,365 people who changed their place of residence in South Khorasan, the origin of 33,459 people (53.7 percent) was the same province as the destination, South Khorasan; this is called internal migration. Therefore, the number of people who moved into the province from outside of it equals 28,906. Meanwhile, in the same period of time, 31,199 people left the province. Consequently, the net migration in the province was negative (-2,293 people)
During the period 2011-16, Razavi Khorasan province has been the main province of origin for inter-provincial immigration to South Khorasan; 13,456 persons (46.6 percent of immigrants) moved from that province to South Khorasan. Sistān o Balučestān, Tehran, and Golestān were the next three leading provinces of origin, with 4,623 people (16.0 percent), 1,973 people (6.8 percent), and 1,568 people (5.4 percent) respectively. This was also true for the previous quinquennial period (2006-11), except for the ranking of the last three provinces (based on the results of SCI, National Census, 2011 and 2016). Razavi Khorasan was not only the main origin of inter-provincial immigration to South Khorasan, it was also the main destination for migration from this province. During the period 2011-16, 17,256 people (55.3 percent) migrated from South Khorasan to Razavi Khorasan province. The provinces of Tehran, with 3,913 migrants (12.5 percent), and Yazd, with 1,964 migrants (6.3 percent), were the next two leading destinations for emigrants from South Khorasan.
Literacy status. Based on the results of the 2016 national census, 669,011 people in South Khorasan were 6 years of age and older, of whom 86.79 percent were literate, 13.18 percent were illiterate, and the literacy status of 0.03 percent was not indicated (Table 58). Literacy status in urban and rural areas was still significantly different. While the literacy ratio in the urban areas was more than 92 percent, in the rural areas it was less than 80 percent. This difference was true among men and women (90.4 against 83.0). In general, the highest literacy ratio was among urban men (94.6 percent), and the lowest was for rural women (73.6 percent).

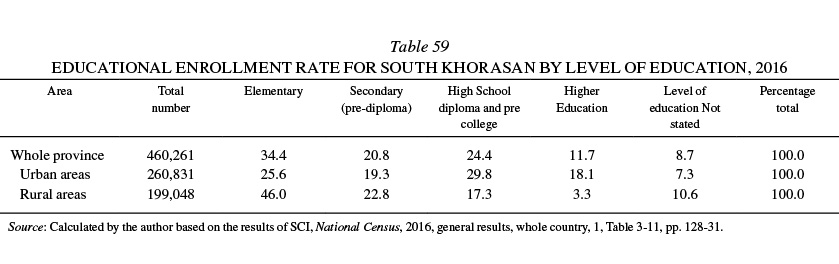
There are several points to note regarding the level of education. Based on the results of 2016 national census of the province, the rural enrollment rate (46.0 percent) was higher than that of urban areas (25.6 percent). It was the same in secondary school (pre-diploma). But in high school, and especially in higher education levels, conversely, the enrollment rate for rural students was significantly lower than that for urban students, which can be interpreted as a higher educational decrement among rural students in the province (Table 59).
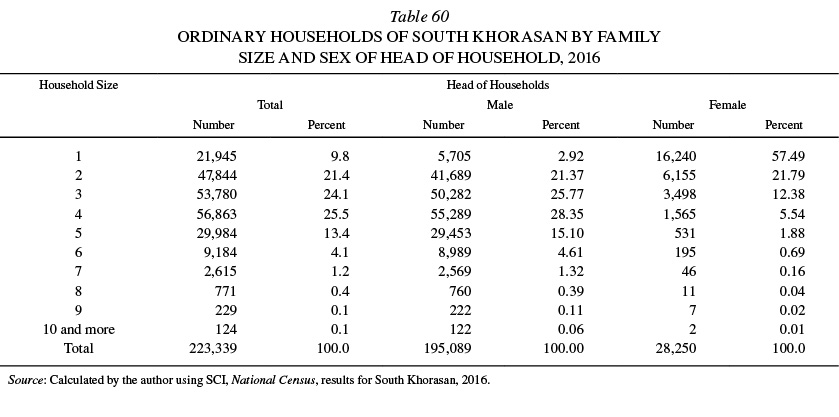
Household and housing. Of 223,984 households in South Khorasan province, 223,339 (99.7 percent) were ordinary and the rest were collective or institutional households, according to the results of the 2016 national census. A tendency toward smaller households is observable, as households with 2, 3, or 4 members make up 71 percent of total ordinary households (Table 60). This was different between households headed by a man and those headed by a woman, the former being typically 4-member households (28.35 percent), while the latter were typically single-member households (57.49 percent).
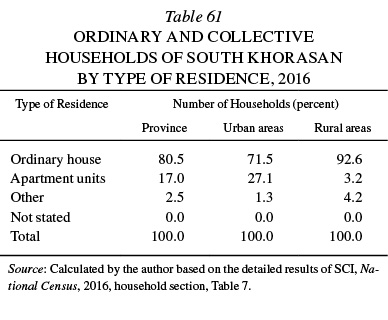
Of the total of 223,578 ordinary and collective households of South Khorasan, most (80.5 percent) were in ordinary houses and only 17.0 percent were in apartment units. Living in apartment units, an indicator of modernization, is much more prevalent in urban areas (27.1 percent) than in rural areas (3.2 percent). The relative distribution of households according to the type of residence is shown in Table 61.
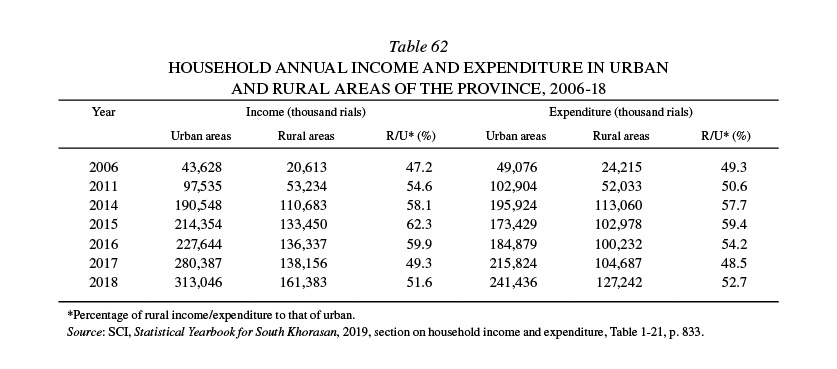
Household income and expenditure. Data on income and expenditure for urban and rural households of South Khorasan is shown in Table 62. The data in this table indicates that, prior to 2015, expenditures were higher than income. This phenomenon, which is prevalent in many other provinces as well as in the country as a whole, is probably the result of not including some minor source of income, especially non-cash income in small cities and rural areas. This must be kept in mind when using the data. Two main points are noteworthy in these figures. For South Khorasan, (1) the percentage of rural income to that of urban, as an index of income gap between the two societies, shows that the trend of income increases in rural areas had been faster than that of urban areas, especially in the years around 2014 and 2015, when the percentage rose from 47.2 percent in 2006 to 62.3 percent in 2015. Subsequently, the percentage rapidly decreased to 51.6 percent by the year 2018; (2) the percentage of rural expenditure to urban expenditure is almost the same as that of income. This shows that in South Khorasan province the balance between income and expenditure in rural areas is the same as in urban areas.
The relative share of major items of expenses in rural and urban areas of South Khorasan for the year 2018, presented in Table 63, shows a different share of expense items between rural and urban areas, but the widest discrepancies belong to food and smoking (31.9 percent in urban versus 44.8 percent in rural areas) and housing (21.5 percent in urban versus 13.7 percent in rural areas).
Activity status. According to the results of the 2016 national census, 613,454 people (79.8 percent of the total population) in South Khorasan, were 10 years of age and older; of them, 36.9 percent were economically active, 62.6 percent were economically inactive, and 0.5 percent had not indicated their activity status (Table 64). The employment ratio in the province was 88.0 percent (89.8 percent for men and 78.6 for women), and 12.0 percent were unemployed and looking for work.
Most of the inactive population were homemakers (48.6 percent) and mostly women. Students were the second largest subgroup (33.8 percent), and unlike homemakers most were men. Analysis of the trend of activity and unemployment ratios in this province in the period 2006-18 leads to the results shown in Table 65.
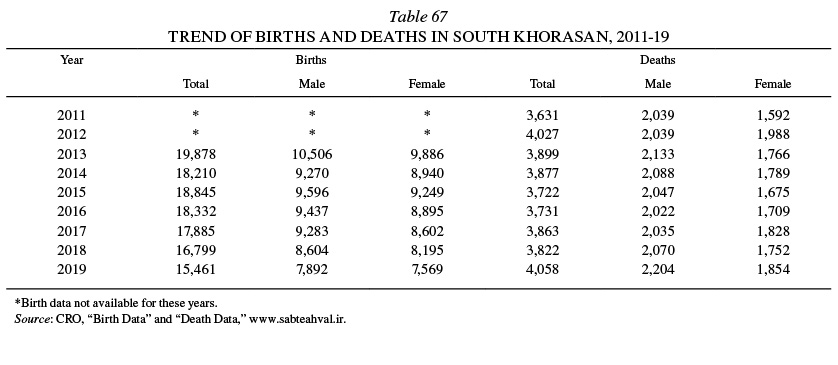
Fertility and mortality. Changes in the rate of births and deaths in South Khorasan province are shown in Tables 66 and 67. It should be noted that registration of births has become highly desirable in recent years due to economic subsidies for each birth, while the registration of deaths is not fully covered yet. Birth registration coverage was announced as 94.7 percent during the same calendar year as birth and 96.8 percent by the year following birth (CRO, Yearbook 1391 Š., p. 168). The decreasing number of births, a trend of concern to most Iranian demographers, is clearly observed in South Khorasan too.
Regarding causes of death, the highest number of deaths in 2019 was due to cardiovascular diseases (1,253 cases), followed by ill-defined conditions (668 cases), respiratory disease (537 cases), accidents (395 cases), cancer and other neoplasms (379 cases), infections and parasites (168 cases), and unknown causes (112 cases) (CRO, “Vital Statistics,” 2019, table 8).
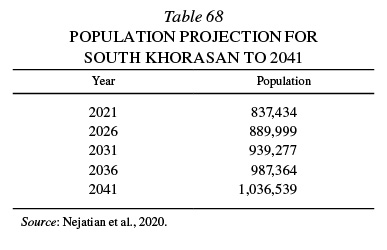
Population projection. Population projection is not an independent activity and usually takes place as part of development or planning projects. The last population projection for South Khorasan was done as the demographic studies of the project of “Water Transmission to the Center of the Iranian Plateau from the Persian Gulf” (Nejatian et al., 2020). According to the findings of this study, the population of the province is estimated to be 1,036,539 people in 2041. More details regarding this projection are given in Table 68.
Bibliography
- [CRO] Vezārat-e kešvar (Ministry of the Interior), Sāzmān-e ṯabt-e aḥvāl-e kešvar (National Organization for Civil Registration), “Dādahā-ye velādat (Birth Data),” various years, available at https://www.sabteahval.ir/avej.
- Idem, “Dādahā-ye marg (Death Data),” various years, available at https://www.sabteahval.ir/avej.
- Idem, Special Issue of Vital Events Registry in 2012, October 2013.
- Idem, Sāl-nāma-ye āmārhā-ye jamʿiyati 1392 (Yearbook of Population Statistics 2013), Tehran, August 2014 (other years online at www.sabteahval.ir).
- Idem, “Vital Statistics Yearly Summary,” various years, available at www.sabteahval.ir/avej.
- Moḥammad-Ḥosayn Nejātiān, Ṭāhā Nur-Allāhi, and ʿAli-Reżā Saharḵiz, “Ṭarḥ-e enteqāl-e āb az Ḵalij-e Fārs va Daryā-ye ʿOmān ba markaz-e falāt-e Irān: moṭāleʿāt-e jamʿiati,” Pars Ab Tadbir Consultants, Tehran, 2020.
- [SCI, National Census] Sāzmān-e barnāma va budja, Markaz-e āmār-e Irān (Plan and Budget Organization [later Vice-Presidency for Strategic Planning and Supervision]), Statistical Center of Iran, Saršomāri-e ʿomumi-e nofus o maskan: koll-e kešvar, detailed results and selected findings, 1956, 1966, 1976, 1986, 1996, 2006, 2011, 2016 (digital publications, available at amar.org.ir and also at irandataportal.syr.edu).
- Idem, “Gozida-ye natāyej-e saršomāri-e ʿomumi-e nofus va maskan 1390” (National census selected results 2011), digitally published (available at irandataportal.syr.edu/wp-content/uploads/2011_census_persian.pdf).
- Idem, “Selected Results of the 2016 National Population and Housing Census,” digitally published (available at irandataportal.syr.edu/wp-content/uploads/Iran_Census_2016_Selected_Results.pdf).
- Idem, Statistical Yearbook of Iran, Tehran, 1991, 1996, 2003, 2004; digital publications 2009-2019 available at www.amar.org.ir/english/Iran-Statistical-Yearbook.
- Idem, Saršomāri-e ʿomumi-e nofus o maskan: Natāyej-e kolli-e ostān-e Ḵorāsān-e janubi (National census of population and housing: complete results for South Khorasan province), 2006- .
- Idem, Saršomāri-e ʿomumi-e nofus o maskan: Natāyej-e kolli-e ostān-e Ḵorāsān-e rażawi (National census of population and housing: complete results for Razavi Khorasan province), 2006- .
- Idem, Saršomāri-e ʿomumi-e nofus o maskan: Natāyej-e kolli-e ostān-e Ḵorāsān-e šemali (National census of population and housing: complete results for North Khorasan province), 2006- .
- Habibollah Zanjani et al., Rāh-nemā-ye jamiʿat-e šahrhā-ye Irān 1335-1370, Tehran, 2003 (Population Guide of Iranian Cities, Iranian Center for Urban Planning and Architecture Studies and Research, 2nd ed.).