

KERMAN
iii. Population of the province, sub-province, and city
This sub-entry is divided into three sections: (1) demography of Kerman Province; (2) demography of Kerman Sub-Province; (3) demography of Kerman City.
DEMOGRAPHY OF KERMAN PROVINCE
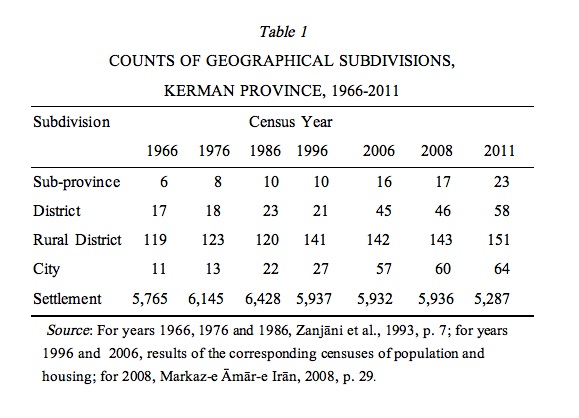
Boundaries. The boundaries of Kerman Province have changed since the first national census of population in 1956. The sub-province of Bandar Abbas (see BANDAR-E ʿABBĀS, now the capital of Hormozgān Province), was included in this province in the 1956 census but was separated from it by 1966. The province was further modified during 1976-1986, when Herāt, Marvast, and a part of Dehaj districts were separated from Šahr-e Bābak, a sub-province (šahrestān) of Kerman Province, and annexed to Mehriz Sub-province in Yazd Province. In the same period, the East Bašāgerd districts in Jiroft Sub-province and six other villages (in Kahnuj Sub-province) were separated from Kerman Province and added to Mināb Sub-province in Hormozgān. Due to these changes, the total land area of Kerman Province, which was 193,978 square kilometers in the 1966 and 1976 censuses, was reduced to 185,657 km2 in 1986 (Zanjāni, 1992, pp. 30-35; Zanjāni and Raḥmāni, pp. 2-85), and then to 180,726 km2 in 2006 by the detachment of a section of Jāz Muriān marsh. Sub-province and district boundaries also have varied over time (Table 1).
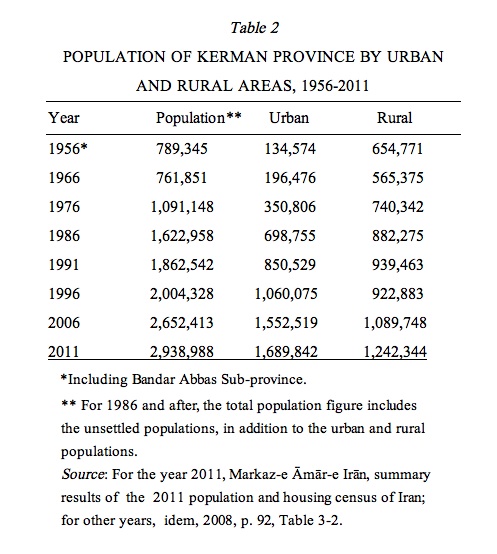
Population and its distribution. Based on the first nationwide population and housing census taken in 1956, the total population of the province was around 789,000 persons (of whom, 127,624 then belonged to Bandar Abbas), while in the 2011 population and housing census, it had increased to nearly 2,939,000 (Table 2).
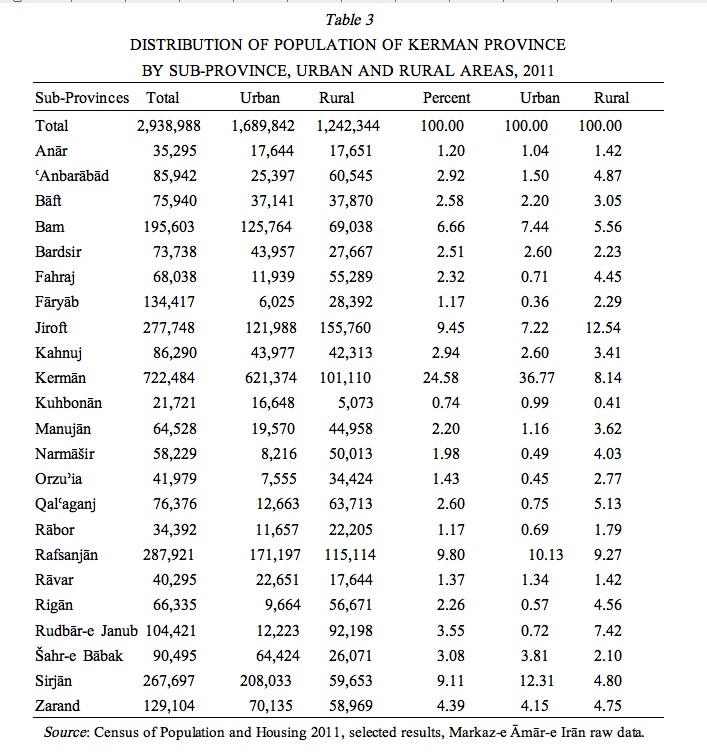
In 2011, the population distribution of Kerman Province indicates Kerman (capital of the province) as the most, and Kuhbonān as the least, populous sub-province. This can be seen in Table 3, in which absolute and relative population distribution of the province by sub-province are shown. It is worth noting that population concentration in Bāft, Bardsir, Rafsanjān, Sirjān, Kerman, and Kahnuj has been decreasing since 1966, and meanwhile Rāvar, Rudbār-e Janub, ʿAnbarābād, Qalʿaganj, Kuhbonān, and Manujān have evolved into sub-province status during the same period.
Age and sex composition. Sex ratio (number of men per 100 women) in the population of the province has been somewhat lower than that of the natural value of this ratio (105), which can be interpreted as the results of a low flow of out-migration in the province. Values of this measure were below natural level in the urban areas of the province during 1955-1975 but have risen closer to natural level since 1986. In the rural areas, in which a flow of out-migration is not unusual, the sex ratios are as expected (Table 4).
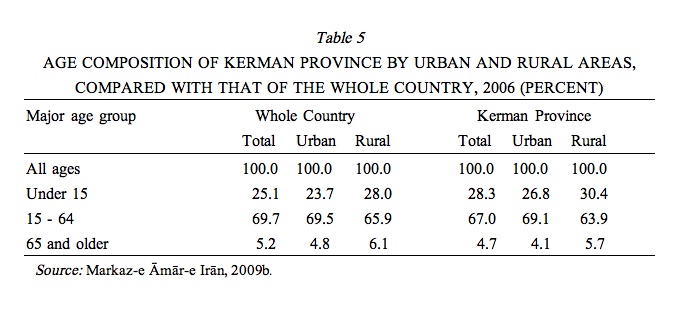
Based on the results of the 2006 and 2011 population censuses, age composition of the province is somewhat younger than that of the entire country (Table 5).
It is observed that the ratio of population in the ages of economic activity in the rural areas is lower than that of the urban areas, which reflects the flow of out-migration in the rural areas. This is more significant in Kerman Province than in the entire country. Population of this province is in the beginning stages of aging (Table 6).
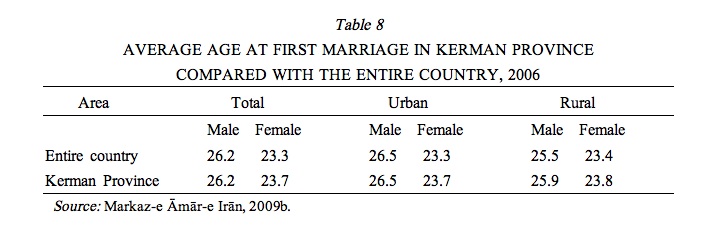
Marital status. Review of the results of 2006 population census shows that the marriage prevalence (percentage of married persons in the population up to 50 years of age) for younger ages in Kerman Province is considerably lower than in the entire country. This is true for both urban and rural areas (Table 7). Despite these considerable differences, average age at first marriage is more or less the same in Kerman as in the entire country (Table 8).
Age at first marriage, although similar between urban and rural areas, is significantly different in the male and female populations—a difference of 2.5 years on average (urban: 2.8 years, rural: 2.1 years). It can also be noted that there is not much difference between marriage prevalence in Kerman Province compared with the entire country: based on the data from 2006 population census, 99 percent of men and 98.6 percent of women in Kerman Province were married before the age of 50, analogous, respectively, to 98.7 percent and 98.2 percent in the entire country.
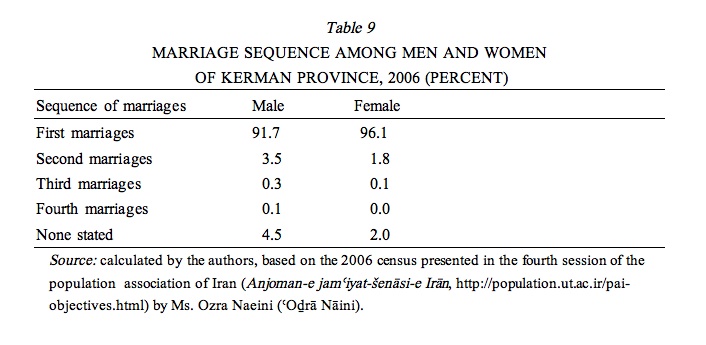
In Kerman Province, most of the first marriages remain permanent, throughout the entire life of spouses. The results of the 2006 population census show that, among those married persons who had stated their sequence of marriage(s), around 97 percent (96 percent for men and 98 percent for women) were continuing their first marriage (Table 9).
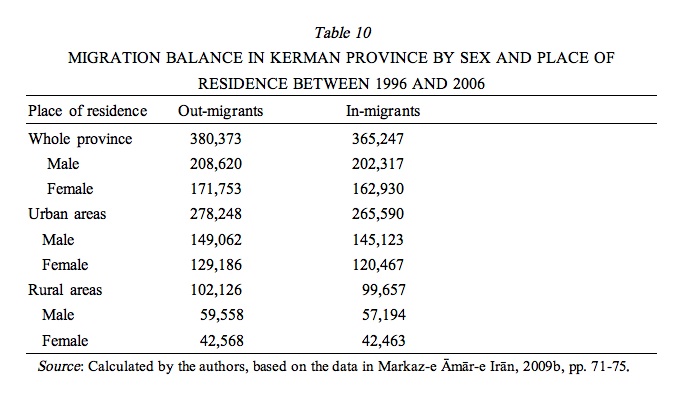
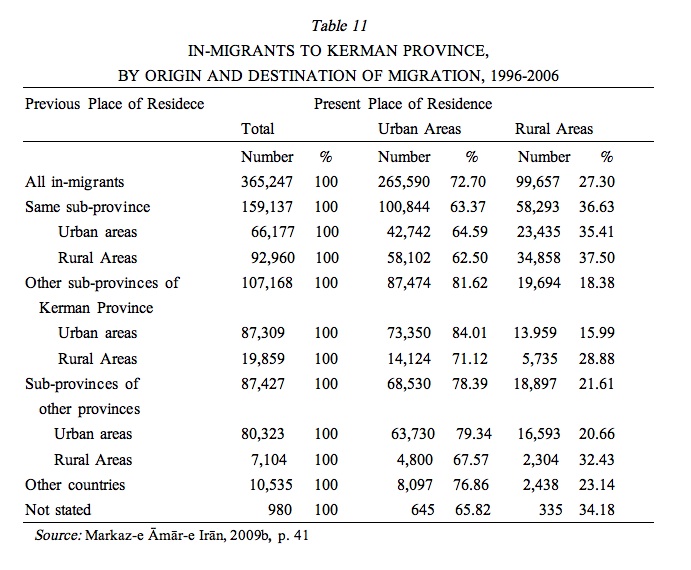
Migration. Based on the results of the 2006 population and housing census, around 365,000 migrants had entered Kerman Province or changed their place of residency inside the province between 1996 and 2006. Of these, 43.6 percent had moved intra-sub-province; 29.3 percent, inter-sub-province; 23.9 percent were inter-provincial migrants; 2.9 percent had been born abroad; and 0.3 percent did not state their migration status.
Among all these migrants, 72.7 percent were settled in the urban areas, and 27.3 percent in the rural areas of the province. Considering the urban and rural ratio of the population in the province (58.5 percent and 41.5 percent), it can be seen that the urban areas have attracted migrants more than their weight in the total population.
Migration balance of Kerman Province during this period has been negative by 25,126 persons. This is true for both urban (‑12,658 persons) and rural areas (‑2,469 persons). Most migration transaction (either in-migration or out-migration) of the province during these ten years have occurred between Kerman and its neighboring provinces of Sistān wa Baluchestān, Hormozgān, Yazd, and Ḵorāsān-e Rażawi, plus Tehran Province. Migration balance of the province, by urban and rural areas, as well as migration status of Kerman Province, by sex, origin, and destination of migrations are shown, respectively, in Table 10 and Table 11.
In the distribution of migrants by cause of migration (Table 12), the main reason given for migration in Kerman Province during the 10 years before 2006 census was to accompany a family household. Almost 40 percent of migrants had no other reason. Job requirements (including job transfer, looking for work or for better jobs) have been the second main cause of migration (20 percent of migrants).
Urbanization. In Kerman Province, the urbanization ratio (that is, the proportion of the population living in areas classed as urban) was 52.89 percent and 58.53 percent in 1996 and 2006, respectively (entire country: 61.3 percent and 68.5 percent). The urbanization ratio varies greatly among the sub-provinces of Kerman. In this period it has been as low as 10.1 percent in Rudbār-e Janub and as high as 84.1 percent in Kerman. This measure has been 17.2 percent in Qalʿaganj, 18.4 percent in ʿAnbarābād, 28.4 percent in Manujān, 38.6 percent in Bam, 41.0 percent in Rāvar, 41.7 percent in Bāft, 43.3 percent in Kahnuj, 52.3 percent in Šar-e Bābak, 54.6 percent in Bardsir, 55.6 percent in Jiroft, 57.3 percent in Zarand—all less than the province level, while the ratio in Kuhbonān (68.3 percent) and Sirjān (76.3 percent) was higher than the province level (based on the results of the 2006 population census, Kerman Province, pp 51- 69, tables 2-1, 2-2, and 2-3).
Between 1996 and 2006, there were considerable changes in the administrative subdivisions of the province; the number of sub-provinces rose from 10 to 16, and the number of cities from 27 to 57. Thus direct comparison of the results of the two censuses does not clearly indicate the urban-rural shift of the province. In Table 13, the results of the 1996 population census are reformulated in terms of the 2006 definitions of administrative subdivisions. Based on these statistics, the average annual rate of population increase is calculated to be 2.80 percent (instead of 3.08) in the urban areas, and 1.67 percent (instead of 3.07) in the rural areas. The ratio of the urban population was calculated by the authors to be 59.38 percent instead of 52.89 percent. If urban and rural subdivisions had remained unchanged during 1996-2006, then the ratio of the urban population would have remained more or less the same as the 1996 value (Zanjāni et al., 2009, pp. 13-14).
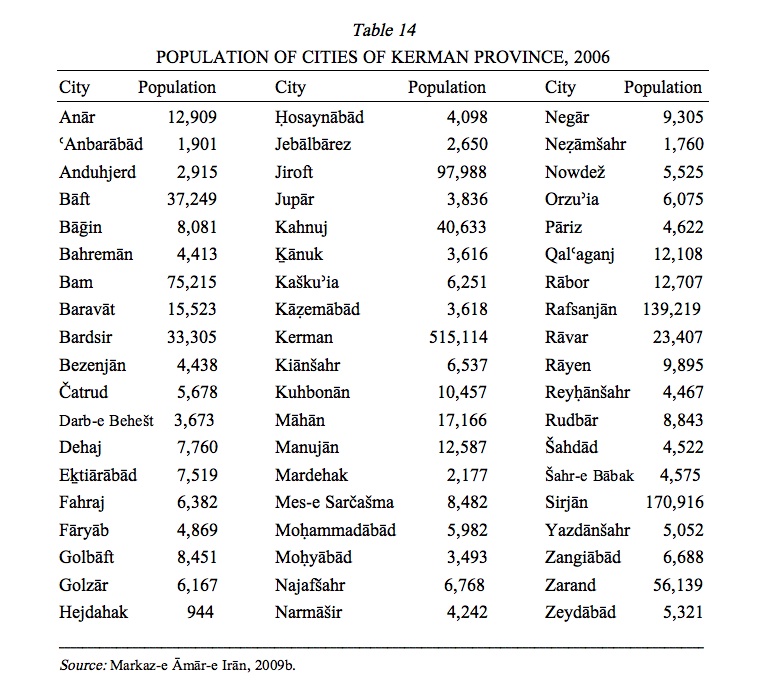
Classification of cities by population size in 2006 shows that, out of 57 cities of the province, 38 cities had a population less than 10,000 persons; 9 cities, between 10,000 and 25,000; 7 cities, between 25,000 and 100,000; 2 cities, between 100,000 and 250,000; there was only one city with population of more than 500,000. Most of the cities in the province appear to be not more than a small town, with average population size about 27,000 persons in 2006. The average for the entire country is greater by 20,000 (Table 14).
The proportion of the rural population to the total in Kerman Province is higher than that for the entire country. This proportion varies considerably between sub-provinces; the highest (89.9 percent) is recorded in Rudbār-e Janub Sub-province; and the lowest (15.9 percent), in Kerman Sub-province. The absolute number of the rural populatiion also varies greatly among Kerman sub-provinces. Based on the results of the 2006 census, the highest and the lowest umber of the rural population numbers belong to Bam (173,207) and to Kuhbonān (7,885), respectively; the recorded counts for the other sub-provinces are: Rafsanjān, 119,803; Bāft, 84,545: Jiroft, 83,284; Kerman, 80,674; Rāvar, 15,111; Bardsir, 40,488; and Manujān, 45,733. Villages in Kerman Province are rather under-populated. On the basis of the results of the 2006 census, the average population per village in Kerman Province is 184 persons (entire country: 374).
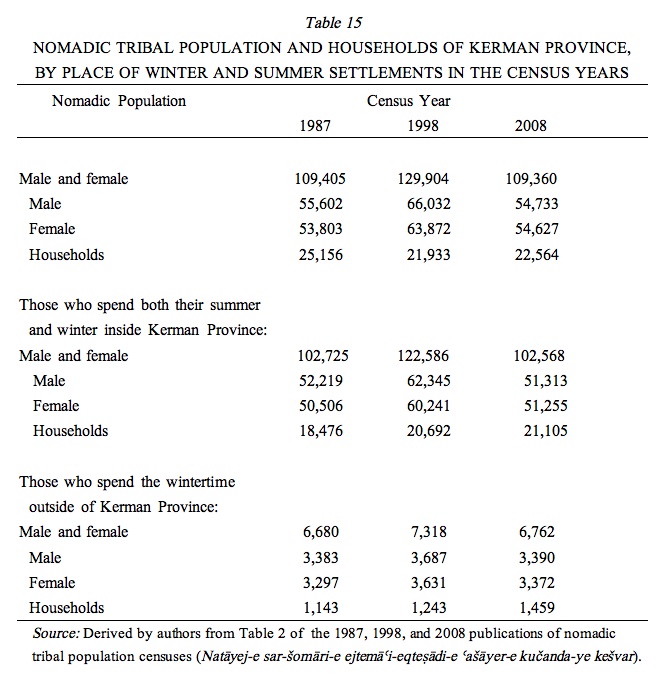
Tribal Population. Censuses of nomadic tribal population were conducted in 1987, 1998, and 2008, with variations in classifications used. It can be concluded, however, that the great majority of the nomadic population of Kerman Province have both their summer and their winter settlements within the province (Table 15). Only a small number spend their winters outside the province, mainly in Hormozgān Province.
Because of the above-mentioned changes made in the administrative system of Kerman Province, the counts of the nomadic population in the several censuses cannot be compared at the sub-province level. But it can be seen that in 2008 most of the nomadic tribal population belonged to the following sub-provinces: Bāft, 24,981 persons in 4,977 households; Bam, 19,006 persons in 3,860 households; Jiroft, 14,152 persons in 2,972 households; ʿAnbarābād, 9,790 persons in 2,029 households; Sirjān, 9,172 persons in 2,049 households. Concerning tribal affiliation, Jebālbārezi, Baluch, and Afšār have had the largest number of members.
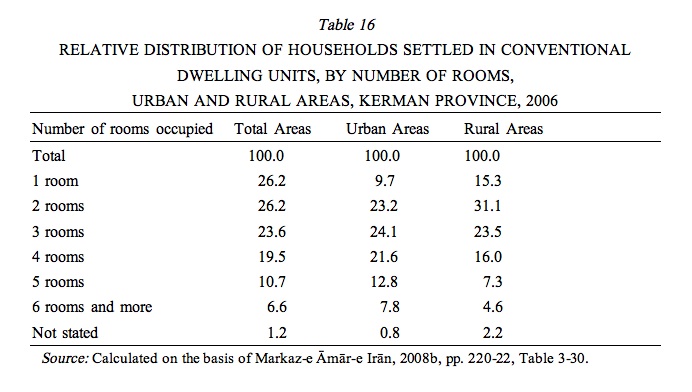
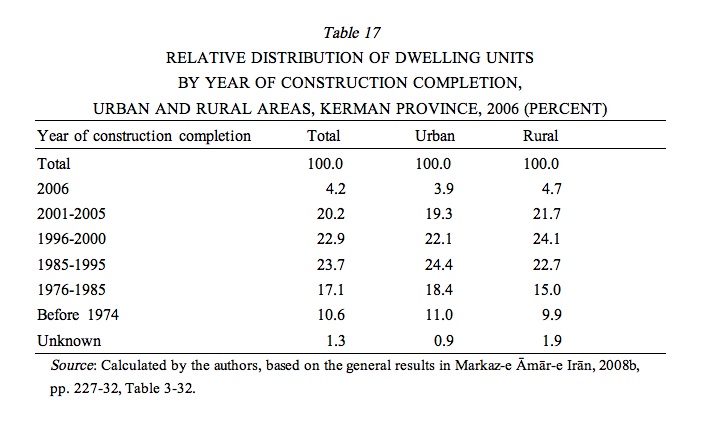
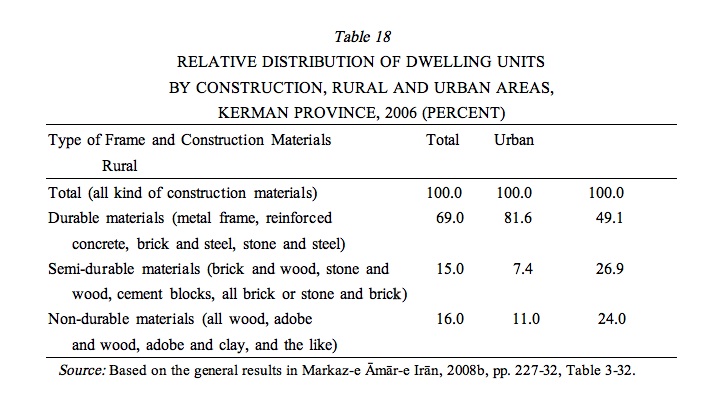
Housing Status. At the time of the 2006 census of the country’s total population and housing status, 615,929 households were living in Kerman Province, of which 615,150 were ordinary settled and collective households, living in the urban (366,790 households) and the rural areas (246,206 households) of the province. (The remainder are unsettled.) These households were settled in 517,652 dwelling units (urban: 316,292 units, rural: 201,360 units). Thus, on the average, there were 119 households per 100 dwelling units (urban: 116, rural: 122). Out of the above-mentioned 615,150 households, 563,512 households were living in conventional dwelling units (urban: 349,964 households, rural: 213,548), distributions of which are shown in Table 16 by the number of rooms. Almost 71 percent of the dwelling units in the province (urban: 69.9 percent, rural: 73.2 percent) were constructed during a twenty-year period between 1986 and 2006 (Table 17). The construction materials used for dwelling units are a subject of concern, especially in the rural areas of the province. Based on the results of the 2006 population and housing census, more than half (50.9 percent) of dwelling units in the rural areas of Kerman Province are made of semi-durable or non-durable materials (Table 18, Table 19).
Altogether, these data suggest that relative frequency of small dwelling units, in terms of both floor area and room numbers, in the rural areas is higher than in the urban areas, indicating that people are harder pressed for housing in the rural areas. Although the percentage of durable dwelling units in the urban areas (81.6 percent) is higher than that of the rural areas (49.1 percent), a historical review shows that the trend of renovation of dwelling units in the rural areas is much faster than in the urban areas.
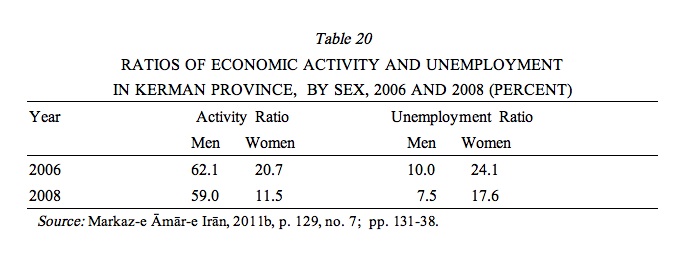
Economic activity status. Based on the results of the 2006 population and housing census, out of 2,183,790 persons aged 10 and over in the province, 40.1 percent are reported to be economically active (urban: 40.0 percent, rural: 41.3 percent). In the same year, the occupation ratio in Kerman Province was 79.0 percent (urban: 82.9 percent, rural: 73.3 percent). Thus, the unemployment ratio has been estimated to be 21.0 percent (urban: 17.1 percent, rural: 26.7). This ratio varies greatly among different sub-provinces; it has been as low as 7.3 percent and 8.2 percent in Rudbār-e Janub and Rāvar, respectively, while other sub-provinces have been experiencing considerably high rates, among them Qalʿaganj (45.5 percent), ʿAnbarābād (44.8 percent), Jiroft (40.5 percent), Šahr-e Bābak (40.4 percent; Markaz-e Āmār-e Irān, 2009, p. 84, table 3-11). Sex differentials in the ratios of activity, employment, and unemployment are considerable.
Moreover, in the entire Kerman Province, the activity ratio, and consequently the employment ratio, have been declining in recent years (2006-08) among both men and women (Table 20).
In 2006, most of the employed population (42.8 percent) was working in the service sector (urban: 57.5 percent, rural: 19.1 percent); the agriculture sector provided jobs for 28.2 percent of the employed population (urban: 9.6 percent, rural: 58.0 percent), and only 25.5 percent of the employed people were working in the industrial sector (urban: 30.7 percent, rural: 19.9 percent).
In Kerman Province, almost three-quarters (72.2 percent) of employed individuals were working in the private sector, and only 25.6 percent were involved in the public sector (the other 2.2 percent: not stated). These overall ratios are estimated to be, respectively, urban: 64.8, 33.1, and 2.1 percent, rural: 84.0, 13.7, and 2.3 percent.
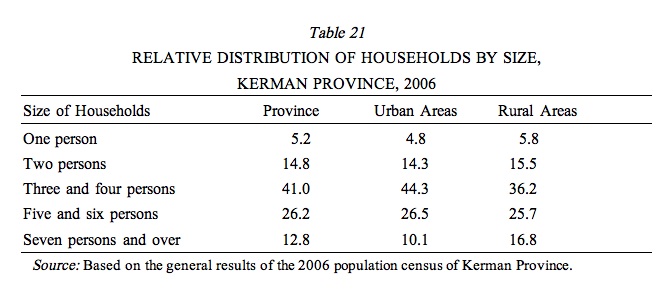
Household Conditions. In Kerman Province, the household average size was 4.3 persons in 2006 (Table 21). There was little difference between the urban (4.2) and the rural areas (4.4). During the years 1956-76, the value of this measure varied between 4.36 and 4.65 persons with no significant difference between the urban and rural areas (less than 0.1). However, in 1991 this figure reached the maximum of 5.37 persons (urban: 5.18, rural: 5.54), and it has been declining ever since.
Out of 606,348 ordinary settled households of Kerman Province, 91.9 percent of the population have been living in conventional dwelling units, 0.5 percent in tents, 4.6 percent in huts, 0.4 percent in hovels and caves, and 2.6 percent in other kinds of structure; 72.7 percent of the households were owner-occupants (urban: 66.6, rural: 83.3), 18.0 percent were renters (urban: 24.9 percent, rural: 6.7 percent), and the rest were living in free units belonging to the organization they served, or other kind of units (Markaz-e Āmār-e Irān, 2009b, table 3-2). There is close similarity between the size of households in the urban and rural areas.
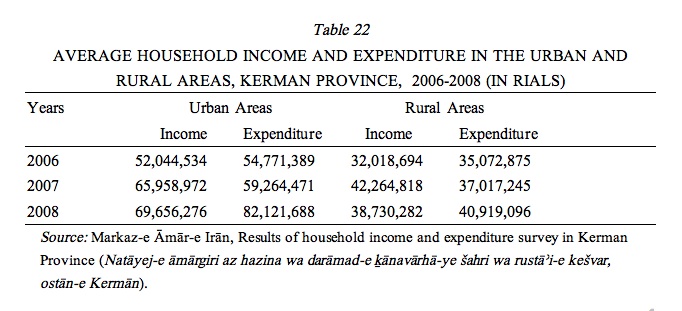
Household income and expenditure. Since transition from traditional life to modern society has considerable impact on lifestyle, household income and expenditure may be counted as an important development index. The most recent information on household income and expenditure of Kerman Province dates from 2008. These data are usually prepared on the province level and do not provide information on any of its administrative subdivisions.
Over a three-year period (2006-2008), average annual expenditure of households shows an increase of 49.9 percent in the urban and 16.7 percent in the rural areas (Table 22). The rate of increase of urban household expenditure experienced a real transformation between 2007 and 2008, reaching 38.6 percent, from 8.2 percent in the previous year; in part, this may be due to the fuel rationing in 2007 and end of some price supports, leading to higher prices.
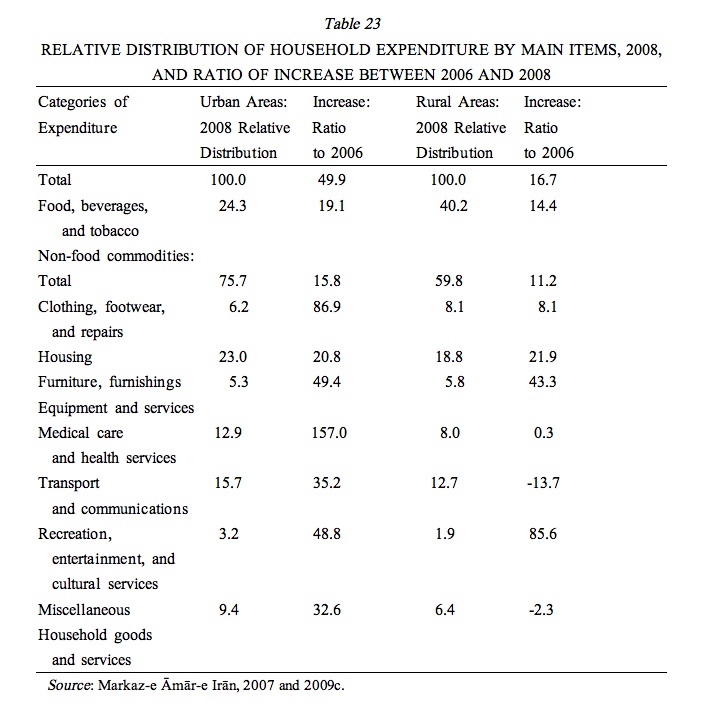
Another notable point is the high and increasing differences between urban and rural household expenditure in the province. As is noted in Table 22, in 2008 the annual household expenditure in the urban areas was more than twice that in the rural areas. The breakdown of household expenditure in terms of major categories (Table 23) shows that the cost of non-food commodities in the urban areas increased rapidly at this time, from 32.7 million rials in 2006 to 62.2 million rials in 2008—an increase of 90 percent in two years, while in the rural areas non-food costs went up by only 24 percent, from 13.27 to 16.46 million rials. In general, medical care and health expenses in the urban areas, and recreation, entertainment, and cultural service expenses in the rural areas (despite their low relative importance), had the greatest increase during 2006-2008. Meanwhile, costs of furniture, equipment, and services in the rural areas also had a considerable increase. In the same period, urban and rural household income increased by 33.8 percent and 21.0 percent, respectively. It is noteworthy that in 2006 and 2008 household expenditure exceeded income (Markaz-e Āmār-e Irān, 2011b, pp. 663-72, tables 20-2, 20-3, and 20-4, for expenditures, and pp. 679-82, tables 20-6, 20-7, for incomes).
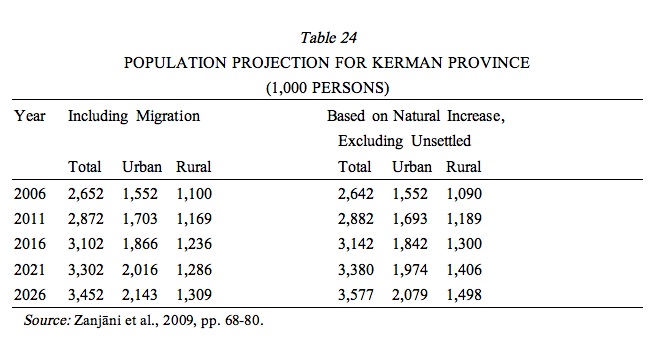
Population projection of the province. In the last nationwide population projection done in 2009, projection was made for Kerman’s population in the period from 2011 to 2026 (Table 24).
DEMOGRAPHY OF KERMAN SUB-PROVINCE
General characteristics. Kerman Sub-province comprises 6 districts (baḵš), 19 subdistricts (dehestān), 13 cities, and 1,169 villages, of which 551 villages are settled. It has been recorded as the most populated sub-province in Kerman in all population censuses.
In 1996, 28.82 percent of the province’s population was living in Kerman Sub-province, while in 2006 this proportion was reduced to 25.55 percent, mainly because Rāvar District had been turned into a new, separate sub-province. The new Kuhbonān Sub-province has been reported to have a population of 39,463 persons (urban: 24,351, rural: 15,111). Correspondingly, the proportion of urban population of Kerman Sub-province decreased during the same period, from 43.45 percent (460,602 out of 1,060,075) in 1996 to 38.45 percent in 2006 (596,976 out of 1,552,519), while the absolute number increased by 136,374. The rural population of Kerman Sub-province was reduced from 117,077 people in 1996 to 80,674 in 2006 (that is, from 12.4 percent to 7.33 percent of the total rural population of the province). This can be regarded as partly the result of the separation of Rāvar Sub-province from Kerman and partly due to the rate of out-migration; also, some villages have been made cities (based on Markaz-e Āmār-e Irān, 2009b, p. 49, table 2-1). During the same ten-year period, the urbanization rate in Kerman Sub-province increased from 79.73 percent to 88.10 percent, which is 30 points higher than that of the entire province.
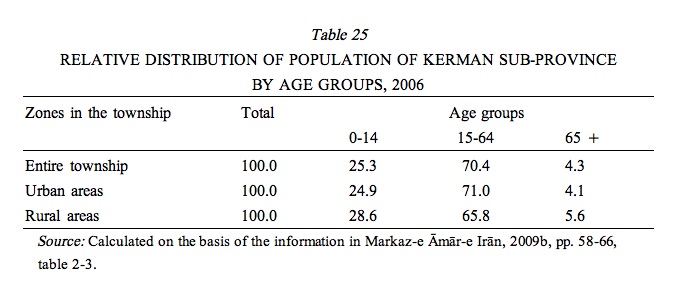
Age-sex composition. In 2006 the population sex ratio in Kerman Sub-province, was recorded as 105 males per 100 females (Table 25). Further calculations for each sex shows more or less the same figures for male and females
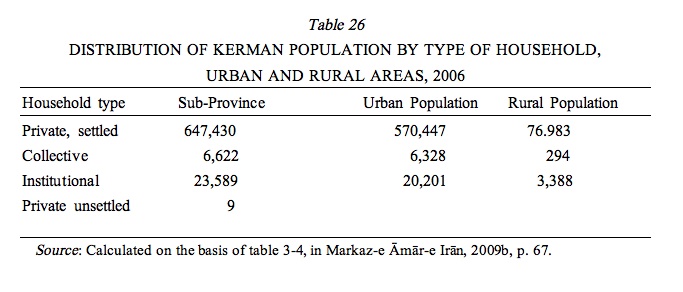
Type of households. Based on the results of 2006 census, out of 166,952 enumerated households in the sub-province, 147,734 households were settled in the urban areas, 19,218 households in the rural areas, and 9 others were unsettled (Table 26). Members of the collective and institutional households are mostly men (5,339 men against 1,283 women in the collective households and 15,920 men against 7,669 women in the institutional households).
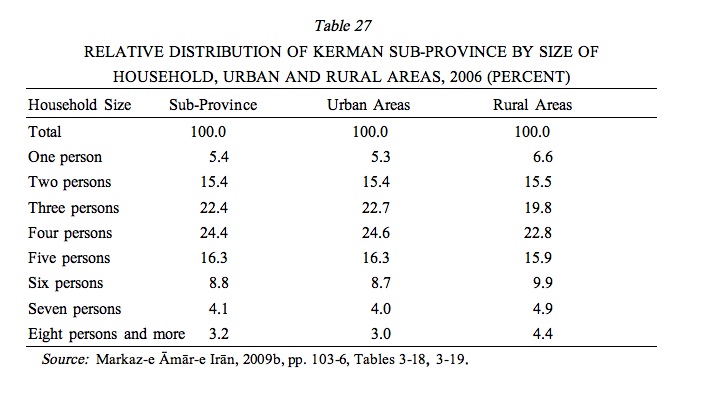
Average household size (Table 27) is calculated to be 4.06 persons per household (4.04 in the urban and 4.20 in the rural areas), which decreased between the years 1996 and 2006 by 0.83 persons per household. The proportion of four-person households is higher than any other size of households in both urban and rural areas. The household-size differential between urban and rural areas of the sub-province has lessened in recent years. In 2006, most of the households in Kerman Sub-province (89.1 percent) had a male head of household (urban: 89.0 percent, rural: 90.1 percent).
Literacy and education (Table 28). Out of the total population of Kerman Sub-province, in 2006, 610,510 persons were at the age of 6 years and over, including 543,531 city residents and 66,979 persons living in rural areas. The literacy rate was 89.0 percent in the entire sub-province (urban, all: 90.6 percent, men: 92.4, women: 88.8; rural, all: 87.6 percent, men: 79.3, women: 73.8).
Migration status. (1) Lifetime migration. This term is applied to persons who leave their place of birth at least once and reside in a new location. One is counted as such at the time of a census or survey by comparison of the recorded place of birth and place of residence. All those who live in a place different from their place of birth are considered as lifetime migrants. In 2006, slightly over 67.5 percent of the sub-province population were living in the same area in which they had been born (urban: 67.2 percent, rural: 70.2 percent). Thus the rest (approx. 32.5 percent) would be defined as lifetime migrants. Of the urban population, 21.1 percent were migrants with urban origin, 9.5 percent migrants with rural origin; 1.8 percent were born abroad, and 0.4 percent did not state their migration status (rural: 18.3, 7., 3.6, and 0.5 percent, respectively; Markaz-e Āmār-e Irān, 2009b, pp. 71-72, table 3-5).
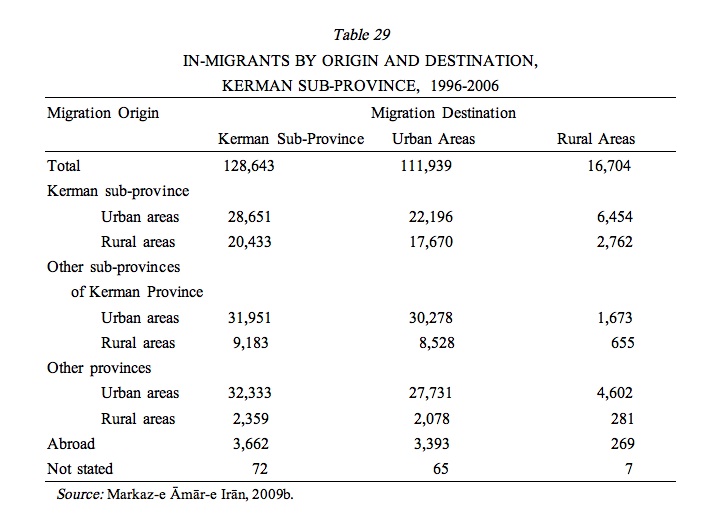
(2) Period migration. Those migrants who change their place of residence between two specific times (usually two successive censuses) are called migrants in that period of time. Between the years 1996 and 2006, in total, 128,643 people changed their place of residence inside the sub-province; of these, 111,939 persons moved to the urban areas and 16,704 moved to the rural regions (Table 29).
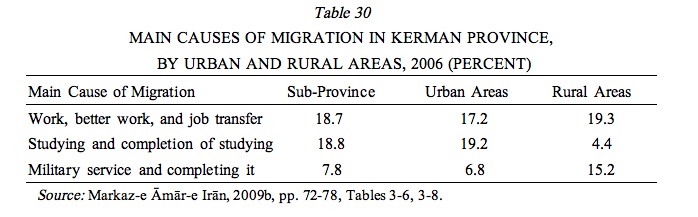
Causes of period migration. Almost 41 percent of the period migrants during the 10-year period between 1996 and 2006 are subordinate or dependent migrants. These are individuals who migrate just to follow the head of their household. The proportion of subordinate migrants in the urban and rural areas of Kerman Sub-province is 40 percent and 46 percent, respectively. Other migration causes are shown in Table 30.
Economic activity and occupation status. Based on the results of 2006 population and housing census, more than 40 percent of the population of Kerman Sub-province, 10 years of age and older, were economically active. The number was higher in the rural areas (44.0 percent) than in the urban areas (39.7 percent). Out of the active population in the entire sub-province, 87.3 percent (urban: 87.2 percent, rural: 88.0 percent) was reported to be employed; in other words, 12.7 percent (urban: 12.8 percent, rural: 12.0 percent) of the population was unemployed, looking for work.
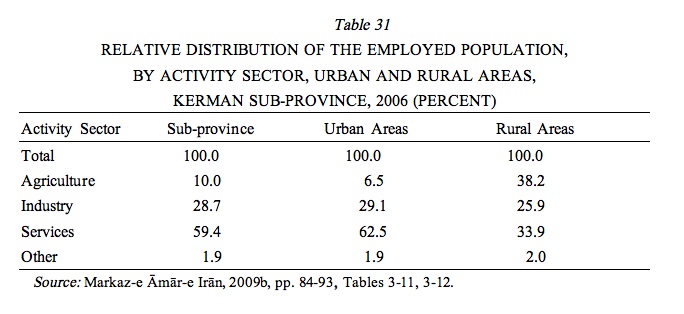
The economically inactive population consists of different groups, the proportions of which vary from one society to another. In Kerman Sub-province, students have comprised the larger share, forming 24.0 percent of the inactive population of the sub-province (urban: 24.9 percent, rural: 16.5 percent). Housewives are reported to have the second larger share in the inactive population (23.4 percent in the entire sub-province, urban: 22.9 percent, rural: 27.3 percent). Pensioners, or generally speaking all those who have an income without working, form only 6.3 percent (urban: 6.6 percent, rural: 4.6 percent) of the sub-province’s inactive population; the rest did not statedtheir activity status (Table 31).
Occupation. In all the Iranian population censuses and surveys, ISCO (International Standard Classification of Occupations) is used for the classification of occupations. In this system, occupations are categorized most generally into nine major groups. Although they do not provide enough details to present a precise description of each occupation, they are informative enough to show the field of occupation of each employed person (Table 32).
Population projection. There is little reliable population projection for Kerman Sub-province. The Markaz-e Āmār-e Irān (2010, p. 32) has estimated the annual growth rate of the population of the sub-province to be 2.67 percent per year, which is an obvious overestimation, in view of the sharp decline in the annual population growth rate of the country (1.3 percent per year). A study on the population of the province (Zanjāni et al., 2009) suggests that the population of the sub-province will be 881,945 persons by the year 2025, increasing 1.41 percent per year. Another study involving nationwide population projection for each province (actually for 52 sub-national zones) has been done by a European consultant (Nejātiān, unpublished). Based on it, the population of Kerman Province for 2025 can be projected to reach 803,000, which is close to the figure suggested in the above-mentioned 2009 study.
DEMOGRAPHY OF KERMAN CITY
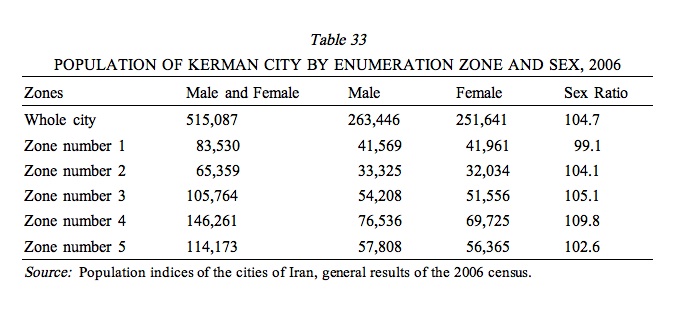
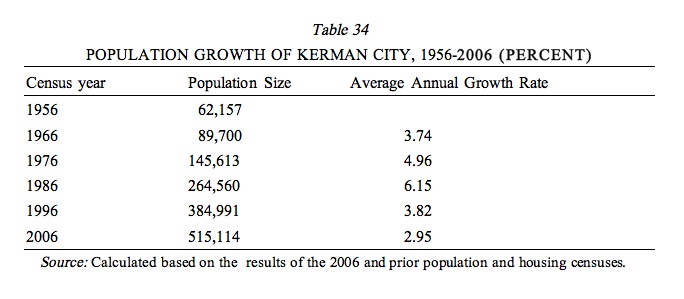
Size and age; sex distribution of the population. The city of Kerman is the capital of Kerman Province and of Kerman Sub-province. In the 2006 population census, Kerman City was divided into 5 zones (Table 33). At that time, its population was reported to be 515,114 (Table 34), of whom 24.4 percent were under 15 years of age, 71.8 percent were 15 to 64 years old, and 3.8 percent were over 65.
Age structures vary significantly between different zones; the proportion of young population (ages 0-15) varies from minimum of 23.0 percent in zones 2 and 3 to the maximum of 25.5 percent in zone 5; the proportion of aged population (65 and over), recorded as 2.6 and 2.8 percent in zones 2 and 3, respectively, was 5.5 percent in zone number 1. The proportion of population in the age group of 15-64 years varied from 69.0 percent in zone 1 to 74.1 percent in zone 2 (Markaz-e Āmār-e Irān, 2010b, p. 62).
The population and its changes. During a 50-year period (1956-2006), the population of Kerman City grew from almost 62,000 to more than 515,000—an average increase of 4.32 percent per year (Table 34). In 2006, among 1,012 cities in Iran, Kerman City ranked thirteenth in size of population, 466th in size of household.
Mean and median age. The mean age of Kerman City’s population in 2006 was estimated to be 27.2 years, varying from the minimum of 26.3 years in zone 3 to a maximum of 28 years in zone 2. The median age was 24 years, varying from 23 years in zones 4 and 5 to 25 years in zone 2 (based on the socio-economic indices of Kerman Province, Markaz-e Āmār-e Irān, 2007a, table 3).
Literacy and education. Based on the results of 2006 population census, more than 90 percent of the population of Kerman City was of school age (6 years of age and older), and 92 percent of these persons were literate. This gives Kerman the thirteenth highest literacy ratio among all cities of the country and matches the city’s rank in population size (see above). The literacy ratio is not constant across the city; the minimum of 91.1 percent was in zone 5, and the maximum of 95.9 percent in zone 2. The literacy ratio for men is 91.1, and for women, 86.7 percent (Markaz-e Āmār-e Irān, 2010b, p. 151, table 3).
Migration. Of the population of Kerman City in 2006, 64.7 percent had been born there, and 35.3 percent were life-time migrants from other parts of the country. In Kerman City, 23.0 percent of the population comprise in-migrants with urban origin, 10.0 percent in-migrants with rural origin, and 1.8 percent immigrants; 0.4 percent did not state their migration status.
Status of economic activity. In the 2006 census data, almost 84.2 percent (433,615 persons) of Kerman City population were of the activity age (that is, 10 years and older), of whom 39.4 percent were economically active and 59.8 percent inactive; the status of the rest (0.8 percent) remained unknown. The activity ratio in Kerman City is somewhat higher than the average rate for cities, placing it twelfth among all cities in the country.
The employment and unemployment ratios of the active population in Kerman City are reportedly 87.1 percent and 12.9 percent, respectively. Comparison of these ratios with those of urban areas countrywide suggests a lower employment ratio and a higher unemployment ratio in Kerman City. Again, Zone 2 is in a better situation with the lowest unemployment ratio (10.5 percent) among all 5 zones; the highest (13.4 percent) belongs to zone 5 (Markaz-e Āmār-e Irān, 2010b, table 5).
Marital status. In 2006, out of 222,002 males 10 years of age and older in Kerman City, 52.0 percent were married, 0.9 percent were widowers, 0.5 percent were divorced, and 46.2 percent were never married; 0.4 percent did not state their marital status. The corresponding proportions for the female population 10 years of age and older were 52.6, 8.2, 1.5, 37.3, and 0.4 percent, respectively. In the Islamic Republic of Iran, legal age for marriage is higher for boys than it is for girls (18 years of age against 15). This can be counted as an explanation for the lower proportion of never-married women. An important point in Kerman City is the extremely high proportion of divorced and widowed women in comparison to men. The proportion of widowhood among women is actually nine times that among men. Similarly the proportion of divorced women is three times that of divorced men.
Marriage prevalence in Kerman City in 2006 was 96.2 percent for men and 98.3 percent for women. Thus there has not been noticed in Kerman City any demographic inbalance between men and women that would result in exclusion of some from the opportunity to marry (what is usually called “marriage squeeze”). Almost everybody gets married sooner or later. Despite high marriage prevalence in the city, the rate of early marriage (marriage at the age group of 15-19) was not high, especially for men (1.77 percent), though not negligible for women (11.4 percent). Even with the relatively high proportion of early marriage among women in the 2006 census, it is lower than in previous census years. These measures altogether indicate clearly a delay of marriages and an increase in the mean age at marriage. As a result, in 2006 mean age at marriage is calculated to be 26.5 years for men and 24.0 years for women (Markaz-e Āmār-e Irān, 2010b, pp. 284, 344, 374, tables 6-8).
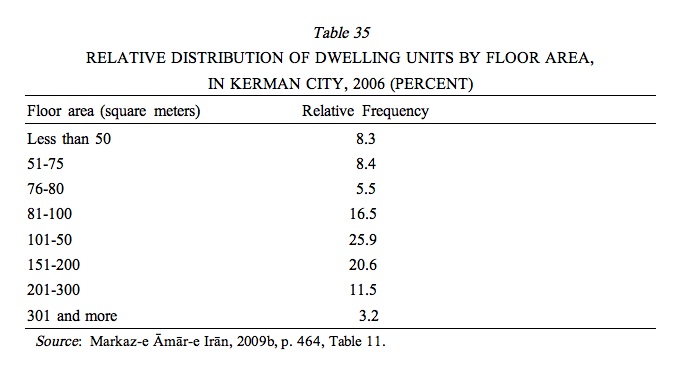
Type of households and housing status (Table 35). Out of 127,936 households of Kerman City in 2006, almost 98.4 percent were private, settled households, 1.5 percent collective households, and only 0.1 percent institutional households (Markaz-e Āmār-e Irān, 2010b, p. 434, table 10). Almost all (99.9 percent) abodes of the city were ordinary units, with an average of 4 residents each.
Population projection. Population projection for cities is not a systematic process in Iran and usually depends upon development plans or case studies needed in larger plans. Based on a study done as a part of Kerman water supply project (Nejātiān, 2007), an estimated population of 785,283 can be projected for Kerman City in 2026.
Bibliography:
Markaz-e āmār-e Irān (Statistical Center of Iran, http://www.amar.org.ir/) publications, in chronological order.
Gozida-ye šāḵeṣhā wa namāgarhā-ye ejtemāʿi-eqteṣādi-e Kešvar, ostān-e Kermān, Tehran, 2007a.
Natāyej-e āmār-giri az hazina wa darāmad-e ḵānavārhā-ye šahri wa rustāʾi-e kešvar, ostān-e Kermān, Tehran, 2007b and 2009d.
Natāyej-e tafṣili-e sar-šomāri-e ʿomumi-e nofus wa maskan, 2006, Tehran, 2008a.
Sar-šomāri-e ʿomumi-e nofus wa maskan sāl-e 1385: natāyej-e kolli, Koll-e kešvar I, Tehran, 2008b.
Našriya-ye jamʿiyat-e šahrhā-ye kešvar bar ḥasab-e senn wa jens: koll-e kešvar, 3, 2009a.
Sar-šomāri-e ʿomumi-e nofus wa maskan 2006: natāyej-e kolli-e ostān-e Kermān, Tehran, 2009b.
Gozida-ye namāgarhā-ye jamʿiyati-e šahrhā-ye kešvar bar asās-e natāyej-e sar-šomāri-e ʿomumi-e nofus wa maskan, 1385, Pažuheškada-ye āmār, 2009c.
Jamʿiyat-e šahrestānhā-ye kešvar, Tehran, 2010a.
Gozida-ye namāgarhā-ye jamʿiyati-e šahrhā-ye kešvar bar asās-e natāyej-e sar-šomār-e ʿomumi-e nofus wa makan, sāl-e 1385, Daftar-e āmārhā-ye jamʿiyat, niru-ye kār wa sar-šomāri, code 89-3-8, Tehran, 2010b.
Gozida-ye natāyej-e sar-šomāri-e ʿomumi-e nofus wa maskan, 1390, Tehran, 2011a.
Sāl-nāma-ye āmāri-e 1387: Ostān-e Kermān, 2011b.
Summary Results of the 2011 Population and Housing Census of Iran, unpublished.
Other sources.
Moḥammad-Ḥosayn Nejātiān et al., Ṭarḥ-e jāmeʿ-e ḥaml wa naql-e kešva/ “Comprehensive Transportation Studies of Iran and Population Projection Component of the Project,” unpublished.
Ḥabib-Allāh Zanjāni, Jamʿiyat wa šahr-nešini dar Irān I, 2nd ed., Tehran, 1992.
Ḥabib-Allāh Zanjāni and Faridun Raḥmāni, Rāhnamā-ye jamʿiyat-e šahrhā-ye Irān, 1335-1370, Tehran, 2003.
Ḥabib-Allāh Zanjāni et al., Moṭālaʿāt-e taʾmin-e āb-e šorb wa ṣanʿat-e šahrhā-ye šomāli-e ostān-e Kermān, Tehran, 2007.
Idem, “Sawābeq-e jamʿiyati-e šahrhā wa ābādihā-ye ostān-e Kermān,” Moṭālaʿāt-e taḥawwol-e jamʿiyat-e Irān dar ṭarḥ-e kālbodi-e melli 9, no. 1.
Idem, Pišbini-e jamʿiyat-e Iran tā sāl-e 1405 bā tafkik-e šahri wa rustāʾi, Tehran, 2009.
(Ḥabib-Allāh Zanjāni and Moḥammad-Ḥosayn Nejātiān)
Originally Published: October 2, 2014
Last Updated: October 2, 2014
Cite this entry:Ḥabib-Allāh Zanjāni and Moḥammad-Ḥosayn Nejātiān, "KERMAN iii. Population," Encyclopædia Iranica, online edition, 2014, available at http://www.iranicaonline.org/articles/kerman-03-population-archived (accessed on 2 October 2014).