

KASHAN
iv. Population
Approximately 90 percent of the Kashan Sub-province population lives in the city of Kashan, so the demographic data for the sub-province closely resembles that of the city.
Here, the two geographical areas will be discussed as one demographic entity.
DEMOGRAPHIC CHARACTERISTICS
In this section population size and its distribution, population growth, gender and age ratios, and household size will be discussed.
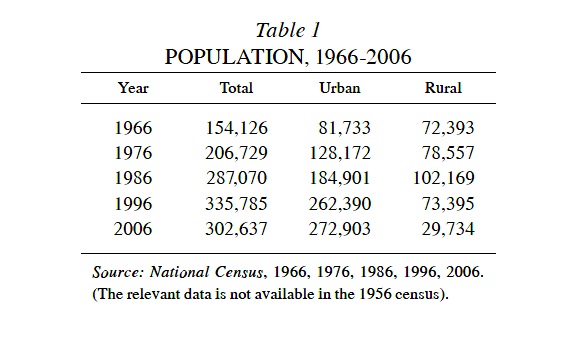
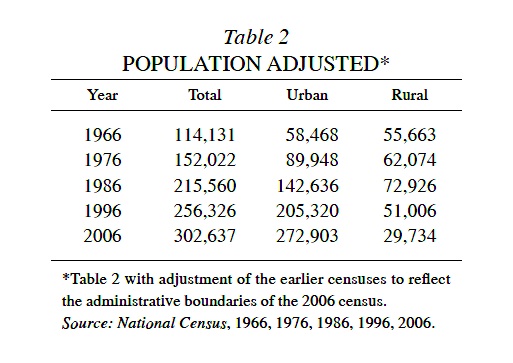
Population distribution. Given the changes in Kashan’s boundaries and administrative divisions in various census years (see i), its population statistics from the first national census in 1956 cannot be directly compared with those produced by the last census in 2006. In order to arrive at a meaningful comparison of the Kashan Subprovince population figures in various census years, the population figures of the sub-province and its townships must be adjusted from 1966 to 1996 according to the definitions of townships and villages used in the 2006 census (see Tables 1 and 2).
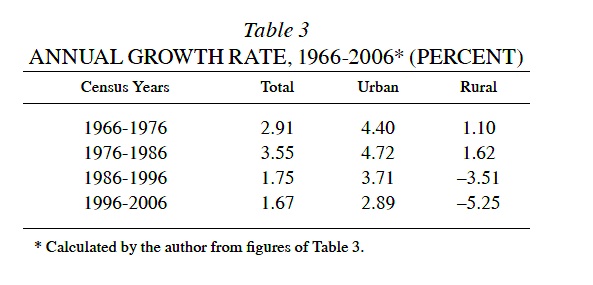
In terms of the distribution of population, in line with the general trends in Iran’s demography, the urban population has continued to increase, while the rural population has steadily decreased. Such trends have been more significantly felt in Kashan Sub-province than the rest of the country (see below). In the course of 50 years, the percentage of Iran’s urban population has increased from 30.4 to 68.5, while the percentage of the urban population in Kashan Sub-province has increased from 28.0 to 90.2. Population growth. As shown in Table 3, the annual growth rate of the population of Kashan Sub-province has decreased since 1966, notwithstanding an upturn between 1976 and 1986, which was mainly due to the increase in birth rates in the years immediately following the 1979 Revolution. This decrease has been especially significant in the rural population, a result of immigration, the transformation of villages into towns, and the disappearance of villages due to urban sprawl; however, the most important contributing factor, which will continue to impact the population in the future, is the decrease in birth rates.
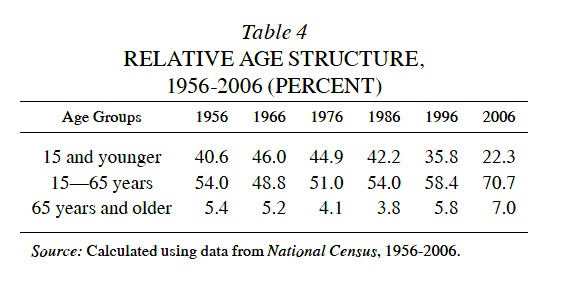
Gender and age ratios. Given the fact that the age distribution of the smaller areas of the sub-province was not reported in previous censuses, we have calculated gender and age ratios based on available wide-range age groups as presented in Table 4.
The high percentage of the population under the age of 15 dropped to under 40 percent for the first time in 1996. This indicated a population transition: Kashan’s population had entered a stage of “senior citizenship” in the period 1996-2006 (according to the description of the UN in 1999, which was designated the International Year of Older Persons). Entrance into senior citizenship for a population requires that at least 8 percent of the population be above 60 years old. The fact that 9.29 percent of the population of Kashan Sub-province was above 60 years old in 1996 and that the percentage of the population under the age of 15 had dipped under 25 percent (22.3 percent) shows a trend towards an increase in the advanced-age population of the sub-province, the impact of which will be experienced in the near future.
In the face of the vast transformation in the age structure of Kashan, the male/female gender ratio has remained constant, between 1 and 1.05 over the past 50 years (cf. isfahan iii[2]). This distinct ratio value will most likely continue in the future. Until there is a significant increase in the life expectancy of women relative to men, the gender ratio will not change significantly.
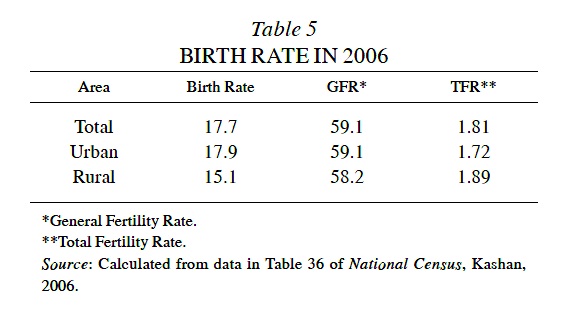
Birth and death rates. Total fertility rate (the average number of children born per woman), general fertility rate (the number of births in 2006 per 1,000 women of reproductive age, generally 15-49), and birth rate (the number of births in 2006 per 1,000 of the population) have been calculated from the data of the 2006 census by urban and rural areas (Table 5).
The data presented in Table 5 shows that with the substitute birth rate of less than 2 children, the optimum replacement rate of 2.1 births for every woman in her fertile years—required to maintain population levels—has not been achieved in Kashan, according to the 2006 data. Coupled with a death rate of 6 per 1,000 for the sub-province, this results in a population growth rate of less than one percent (0.91 percent) in rural areas and more than one percent (1.71 percent) in urban areas.
Household size. In 2006, there was a total of 81,005 households in Kashan Sub-province, of which 73,063 were located in urban areas and 8,753 in rural areas. Of the total number of households, 80,949 were in regular residential units, one was in a tent, two were in an ālunak (hut), and 53 were in other residential units. The average household size of the sub-province was 3.7 (3.73 in urban areas and 3.39 in rural areas). The relative distribution of households based on the number of members is given in Table 6.
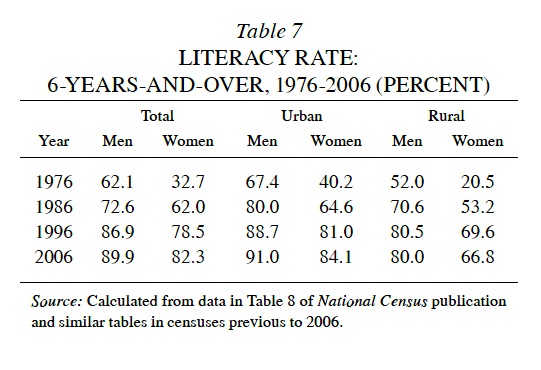
This section covers education and literacy, marital status, residential facilities, and economic activity. Education and literacy. The age range used in compiling census data on literacy has not remained constant, having variously been measured in populations of ten years and older (1956), seven years and older (1966), and six years and older (1976 to the present). Here, the data on literacy and education of Kashan from 1956 and 1966 will be discussed separately and then compared to the data from 1976 to 2006.
According to the first national census of Iran (1956), 23 percent of men and 4 percent of women over the age of ten in Kashan were able to read and write. These rates were 40.1 and 9.9 percent, respectively, in the city of Kashan and 16 and 1.3 percent in rural areas (Table 7).
Marital status. Given the significant changes in the geographical borders of the sub-province and the increase in the number of cities within its boundaries, the data on marital status cannot be directly compared for various census years. According to the 2006 census, 65.7 percent of men and 75.7 of women over the age of 15 in Kashan had been married at least once. These rates were 65.8 and 75.7 percent, respectively, in urban areas, and 64.6 and 75.6 percent in rural areas, which shows that the marked differences in these rates in previous years have been steadily disappearing. Among the 45-49 year age group of men, 98.7 percent have been married (98.9 in urban areas, 96.4 in rural areas), while for women the rate was 98.5 percent (98.6 in urban areas, 97.4 in rural areas). The average age of first marriage for women (calculated from Table 36 of the National Census publication of 2006) was 22.95 (22.9 in urban areas, 24.3 in rural areas); for men it was 26.2 (26.3 in urban areas, 25.9 in rural areas)—a difference of +3.4 years (urban) and +1.6 years (rural), compared with the women’s ages.
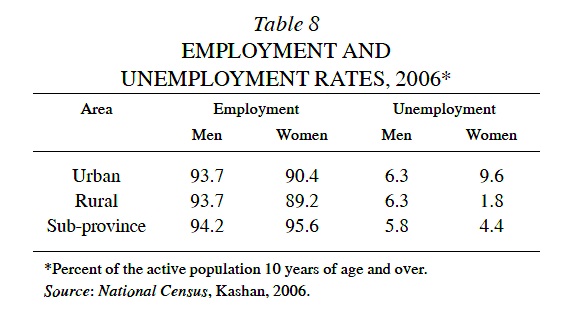
Residential facilities. Of the total number of households in Kashan Sub-province, 74 percent lived in owned units (72.4 percent in urban areas and 84.3 percent in rural areas), 17.8 percent lived in leased or rented units (19.4 percent in urban areas and 4.28 percent in rural areas), and just over 6 percent lived in free units (6.15 in urban areas and 6.29 in rural areas). Other types of residential units did not exceed 2.25 percent. In 2006, more than 99 percent of the households had electricity, and more than 88 percent had plumbing. In urban areas, nearly 95 percent of the households had access to gas lines, and more than 89 percent had telephones, while in rural areas these rates were 26 percent and 80 percent, respectively. The majority of households had baths (94 percent in urban areas and 78 percent in rural areas), and more than 99 percent had bathrooms. Economic activity. In 2006, more than 40 percent of the population of Kashan Sub-province over the age of ten were economically active (64.5 percent of men and 14.2 percent of women). In urban areas, approximately 40 percent of the population of Kashan Sub-province over the age of ten were economically active (63.8 percent of men and 12.7 percent of women), while in rural areas this rate was approximately 49.1 percent (70.7 percent of men and 26.7 percent of women). The rates of employment and unemployment in Kashan Sub-province in 2006 are given in Table 8.
In 2006, 9.8 percent of the employed population were active in the agricultural sector, 48.7 in the industrial sector, 40 percent in services, and the rest in other employment groups. The employment rates in the industrial and services sectors were 49.1 and 43.3 percent, respectively, in urban areas, 31.1 and 46.1 percent in rural areas. In terms of the employment situation, 78.4 percent of the employed population were active in the private sector (77 percent in urban areas and 87.8 percent in rural areas), while 20.5 percent were active in the public sector (21.9 percent in urban areas and 11.2 percent in rural areas).
Bibliography:
Mohandesin-e mošāver-e Naqš-e Jahān Pārs, Ḵolāṣa-ye gozāreš-e hamsān Ṭarḥ-e towseʿ-e wa ʿomrān, Tehran, 2009.
[National Census] Markaz-e āmār-e Irān, Našriyahā-ye tafṣili-e saršomārihā-ye šahrestān-e Kāšān (National Census, Kashan Subprovince), 1956, 1966, 1976, 1986, 1996, 2006.
Ḥabib- Allāh Zanjāni and Mehrangiz ʿAlizādeh Āhi, Bāzsāzi-e dādahā-ye saršomārihā-ye 1345 va 1355 ostān-e Eṣfahān dar maḥduda-ye saršomāri-e sāl-e 1365, Markaz-e moṭāleʿāt wa taḥqiqāt-e šahr-sāzi wa meʿmāri-e Irān, Tehran, 1993.
Idem, Majmuʿa-ye mabāḥeṯ wa ravešhā-ye šahrsāzi, Markaz-e moṭāleʿāt wa taḥqiqāt-e šahr-sāzi wa meʿmāri-e Irān, 3rd ed., Tehran, 1997.
Idem et al., Rāhnemā-ye jamʿiyat-e šahrhā-ye Irān, Markaz-e moṭāleʿāt wa taḥqiqāt-e šahr-sāzi wa meʿmāri-e Irān, 2nd ed., Tehran, 2003.
Idem, Simin Eslāmbolči Moqaddam, and Fereydun Raḥmāni, Rāhnemā-ye jamʿiyat-e šahrhāye Irān, Markaz-e moṭāleʿāt wa taḥqiqāt-e šahr-sāzi wa meʿmāri-e Irān, 2nd ed., Tehran, 2003.
(The author would like to acknowledge with appreciation the translation of this entry by Ali Ahmadi Motlagh.)
(Habibollah Zanjani)
Originally Published: May 1, 2012
Last Updated: May 11, 2012
This article is available in print.
Vol. XVI, Fasc. 1, p. 6-8
Habibollah Zanjani, “KASHAN iv. POPULATION,” Encyclopaedia Iranica, 2012, XVI/1, pp. 6-8, available online at http://www.iranicaonline.org/articles/kashan-iv-population (accessed on 30 December 2012).