

KARAJ
ii. Population
This sub-entry is divided into two sections: Karaj Sub-province and Karaj City.
KARAJ SUB-PROVINCE
Since the 1976 census, when Tehran was no longer counted within the boundaries of Central (Markazi) province and formed its own province, Karaj has been one of its sub-provinces. Originally a relatively large sub-province, Karaj was reduced to its current size when its former townships of Sāvojbolāq, Šahriār, Rebāṭ Karim, and Naẓarābād gradually separated and formed their own sub-provinces. A comparison of the current boundaries of Karaj sub-province with its boundaries in 1966 shows the extent of these changes (see maps of Karaj sub-province, National Census, 1966, 2006).
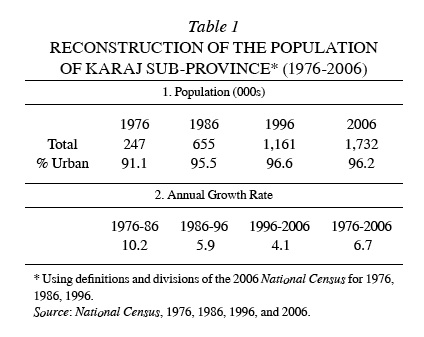
Reconstructing the population of Karaj. Given the differences in Karaj’s boundaries in various census years, its population statistics from the first national census in 1956 cannot be properly compared with those produced by the last census in 2006. In order to make the population of Karaj comparable in various census years, the previous population figures of the sub-province and its townships must be reconstructed according to the definitions of townships and villages used in the 2006 census (see Table 1). Due to the complexities of statistical definitions and the numerous changes in the boundaries of Karaj sub-province, this reconstruction is confined to a 30-year period from 1976 to 2006.
According to these statistics, the population of Karaj sub-province experienced a seven-fold increase during 1976-2006, when its urban and rural populations multiplied 7.4 and 3 times respectively. The average annual growth rate of the population of Karaj sub-province, among both its urban and rural populations, has been even higher than that of Tehran province, which has the highest growth rate in the nation. During the past 30 years, the average annual growth rate of the population of Karaj sub-province has been more than twice (2.16) that of Tehran province, while the growth rate of its urban population has been almost three times (2.88) greater.
Demographic Indexes. The demographic characteristics discussed in this entry include gender ratios, age structure, youth coefficient, dependency ratios, birth and death rates, household size, life expectancy, and population growth rates.
Gender ratios. The sub-province of Karaj had an even gender structure with a male/female ratio of approximately 1.05 in 2006. In Table 2, this ratio has been broken down according to urban and rural populations in the census years 1986, 1996, and 2006.
These figures are reflective of the fact that the rate of immigration to Karaj sub-province, both to its urban or rural areas, has been higher than that of Tehran province, which correlates with the aforementioned population growth figures.
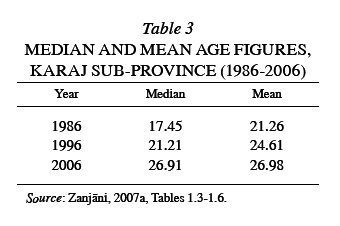
Age structure. The simplest statistics that provide information about age structure are the mean and median ages of a population. While a younger population will exhibit lower mean and median ages, an older population will yield higher figures. The median age is the age that divides the population into two numerically equal groups, and the mean indicates the average age of the population. The median and mean age figures of Karaj sub-province are presented in Table 3.
The differences in these statistics are mainly due to differences in age structure, birth rates, and immigration; they are partly influenced by differences in death rates.
Youth coefficient. The youth coefficient represents the percentage of the population that is less than 15 years of age. It exhibits a decrease when birth rates are lower and an increase when infant mortality figures are improved. The age structure of immigrant populations can also influence the youth coefficient. The youth coefficient of Karaj sub-province has dropped from 46.48 percent in 1966 to 21.85 percent in 2006, a decrease which corresponds to national figures and which has mainly been a result of an ongoing decrease in birth rates. This drastic change in the youth coefficient is indicative of significant changes in the age structure of Karaj sub-province.
Dependency ratio. Dependency ratio is obtained by dividing the total number of people under 15 and over 65 by the total number of people between the ages of 15 and 65. For Karaj sub-province, this rate has decreased from 0.9997 in 1966 to 0.2594 in 2006.
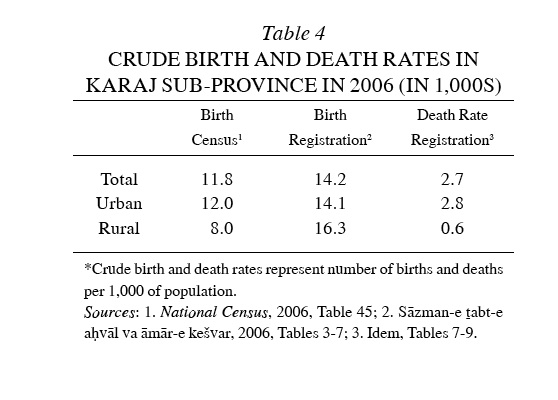
Birth and death rates. The birth and death rates for Karaj province by urban and rural populations, are given in Table 4.
These figures are undoubtedly affected by underrepresentation and miscounting, because the birth rate and the death rate, in particular, are in actuality much higher. Expert opinions indicate a birth rate closer to 18 per 1,000 and a death rate closer to 6 per 1,000, while the natural growth rate can be estimated at approximately 12 per 1,000.
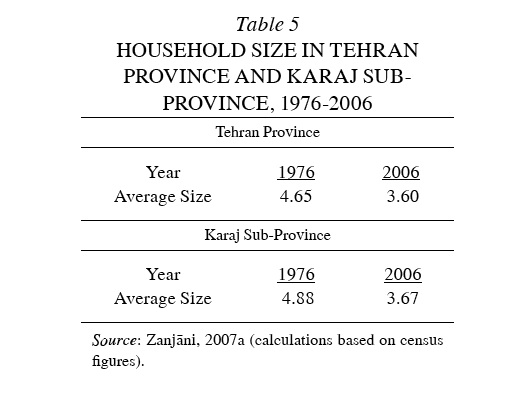
Size of households. Due to declining birth rates and changing lifestyles, the size of households in Iran has seen a steady decrease, a trend that is particularly perceptible in Tehran province and Karaj sub-province. The changes in household size from 1976 to 2006 are shown in Table 5.
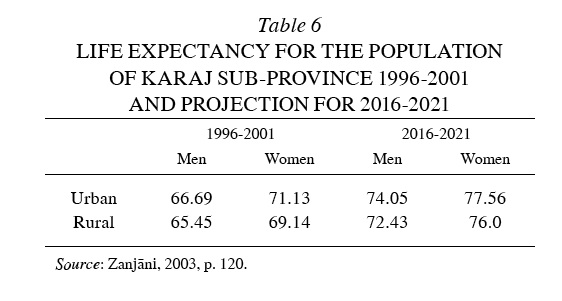
Life expectancy. Life expectancy represents the average number of years that a person born in a designated year is expected to live, if living conditions remain constant. The life expectancy figures for Karaj sub-province during recent and projected years are provided in Table 6.
Social Indicators. Social indicators include literacy rate and education, marital status, migration, and economic activity and employment.
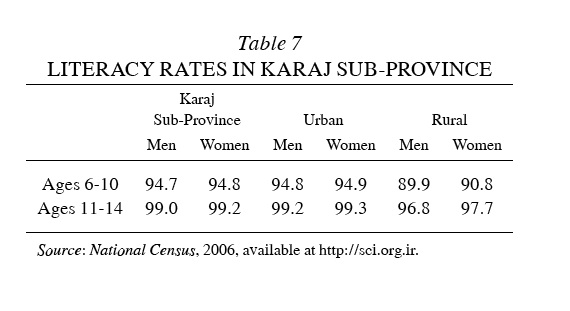
Literacy and education. In 2006, 93.9 percent of the population of Tehran province were literate (94.6 percent of the urban population and 88.4 percent of the rural population). The literacy rates for Karaj sub-province are given in Table 7.
The high rates of literacy indicate that the gaps in levels of education between rural and urban populations, as well as between men and women, have significantly diminished. The percentage of women in the educational system is even higher than that of men, among both urban and rural populations.
Marital status. During recent decades one major development in the marital status of Iran’s population has been an increase in the average age of people at the time of their first marriage, which has been even higher among women. Meanwhile the average length of first marriages has decreased to approximately three years. From a demographic point of view, the increase in the average age of first marriages for women is more significant than that of men, because the resulting reduction in the period of fertility contributes to lower birth rates and, in turn, a lower rate of population growth. According to the 2006 census, the average age of first marriages for women in Karaj sub-province was 23.83 years (23.81 years among urban population and 23.46 years among rural population). These figures indicate that the significant differences between urban and rural averages in previous years have been considerably reduced in recent times.
Another important feature of marital status is the ratio of the percentage of married women between the ages of 15 and 19 to those between the ages of 45 and 49. For Karaj sub-province in 2006, these rates were 14.8 percent and 98.3 percent among the urban population and 14.2 percent and 97.2 percent among the rural population. These figures indicate that, while women have been getting married at a later age, the institution of marriage is still highly prevalent, with approximately 98 percent of women having married at least once by the age of 50. By age 30, 77.5 percent of women in urban areas and 76.3 percent in rural areas had been married at least once.
In the future the average age of first marriages for women will not increase as quickly as it has in previous years, because more regular enrollment in middle and secondary education will have a stabilizing effect. The relatively high rates of marriage among women aged 20-24 (52.6 percent) and those aged 25-29 (78.5 percent) indicate attempts at making up for not getting married at an earlier age.
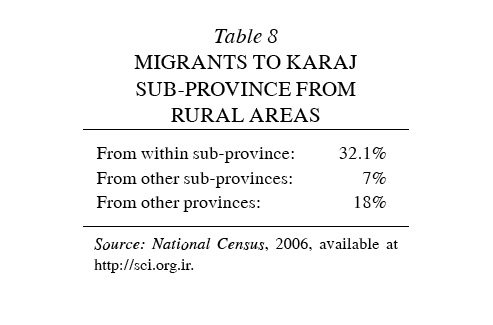
Migration. Much like previous periods, Karaj sub-province had a positive net balance of migration between 1996 and 2006, with a migratory balance of +262,714. During this period a total of 467,508 people migrated to Karaj while 204,794 people left the sub-province. Of the total number of migrants to the sub-province, 211,127 were from Tehran province and had come to Karaj from other sub-provinces; 5.6 percent of migrants in this period were from within the sub-province, 39 percent were from other sub-provinces in Tehran province, 45.7 percent were from other provinces, and 1.7 percent had migrated from abroad. The percentage of migrants from rural areas are given in Table 8.
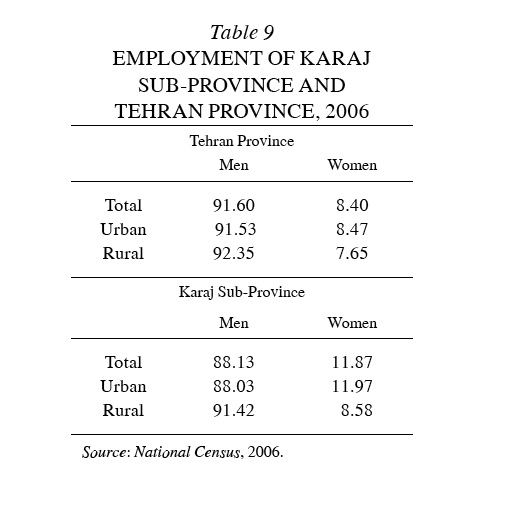
Economic activity and employment. In 2006 approximately 39.1 percent of the ten-year-old and over population in the Karaj sub-province were economically active, of which 39.48 percent were men and 31.01 percent were women. These figures are considerably lower than Tehran province, where 40.48 percent of the population was economically active (40.58 percent of men and 39.37 percent of women).
A comparison of employment figures for the ten-year-old and over population indicates a much higher rate of employment for men, both in rural and urban areas (see Table 9)
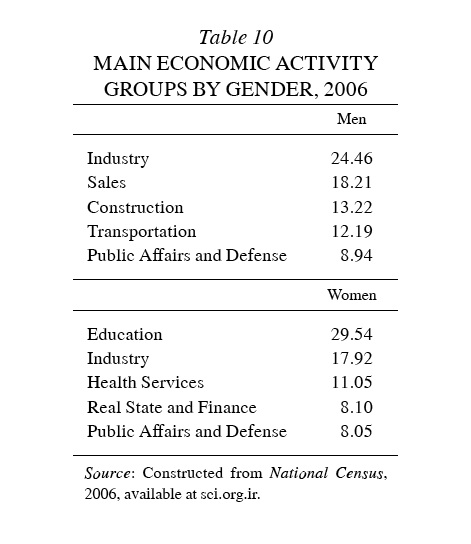
In terms of distribution, the highest percentage of men were active in the industry sector, while the highest percentage of women were active in the field of education (Table 10)
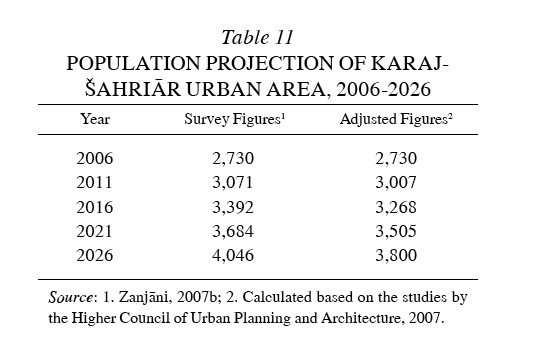
Demographic projection. The most recent demographic studies on Tehran province consisted of a reassessment of its urban population based on the data from the 2006 census. Carried out in early 2008 by the Higher Council of Urban Planning and Architecture (Zanjāni, 2007), these studies projected the population of Tehran province to reach 18.7 million by 2026. For the purposes of these studies Tehran province was divided into 9 urban areas and their suburban populations. The population of the urban areas of Karaj and Šahriār, which account for 98.3 percent of the population of the two sub-provinces, is provided in Table 11.
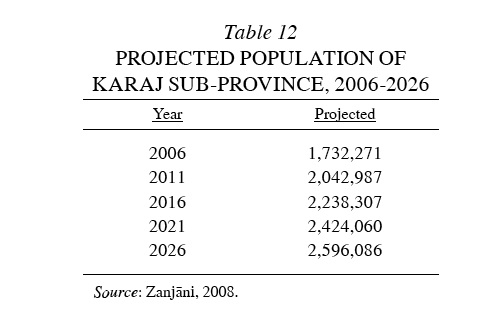
The results of another study (Demographic Studies of South Alborz; see Moqaddam), which looked at the wider area of the southern Alborz region and included the six provinces of Tehran, Zanjān, Semnān, Qazvin, Qom, and Markazi, are provided in Table 12.
KARAJ CITY
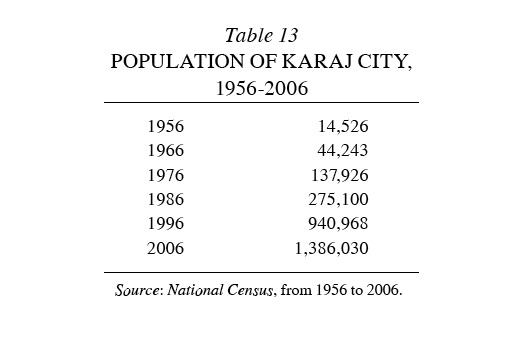
Geographical location of population, 1956-2006. The population of the city of Karaj, the center of Karaj sub-province, increased from 14,526 in 1956 to 1,386,030 in 2006. However, it should be noted that in previous censuses the villages and settlements around Karaj were counted as part of the city. Accordingly, in 2006 Karaj was the fifth most populous city in Iran, after Tehran, Mashad, Isfahan, and Tabriz. Although a proper comparison of population figures for Karaj in various census years is limited by the fluctuating boundaries of the city, it does provide information about population density (see Table 13).
Population of Karaj city, 1956-2006. The population of Karaj city in various census years is provided in Table 14. These figures are based on the differing boundaries of the city in various years and as such cannot be properly compared.
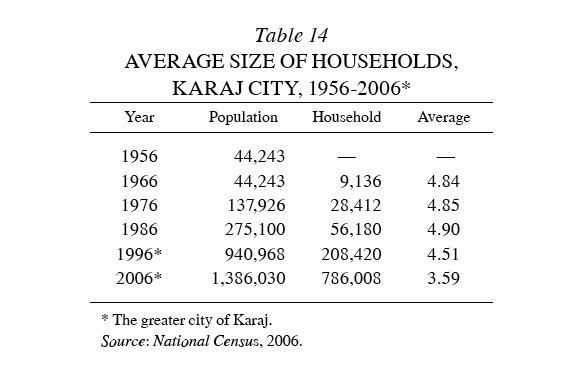
Between 1956 and 1986, the average household size in Karaj city remained relatively large, mainly due to the consistently high birth rates during this period, both among resident and immigrant populations. After a slight decrease in the period between 1986 and 1996, which was due to various factors, household size decreased substantially between 1996 and 2006, with approximately one less person in each household.
Demographic features. Considering the lack of demographic data for every single city in Iran in 2006, the significant fluctuations in city boundaries prior to that year, and the fact that 83.2 percent of the urban population of Karaj sub-province resides in Karaj city, the demographic features of Karaj city are best analyzed in the context of the urban population of the sub-province. These features have been discussed above.
Population projections. The projected populations of Karaj city, according to the South Alborz Regional Plan, are provided in Table 15.
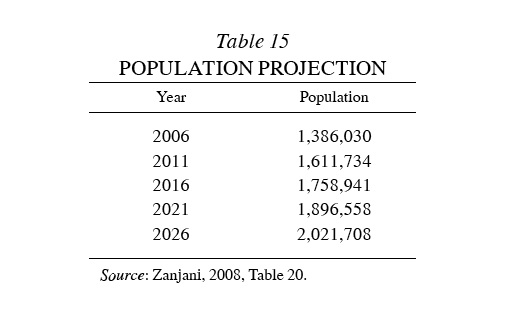
These figures indicate that the population of Karaj city will exhibit a growth rate of 1.91 percent for the 20-year period between 2006 and 2026 and will reach 2 million in 2026.
Bibliography:
Simin Eslāmbolči Moqaddam, Be ruz-āvari-e moṭāleʿāt-e jamʿiyati-e manṭaqe-ye Alborz-e janubi, Markaz-e moṭāleʿāt wa taḥqiqāt-e šah-sāzi wa meʿmāri-e Irān, Tehran, 2007.
National Census (National Census of Population and Housing) for the census years 1956, 1966, 1976, 1986, 1996, and 2006; separate reports were published for the total country, each province, and each sub-province.
Sāzman-e ṯabt-e aḥvāl-e kešvar, Sāl-nāma-ye āmāri, Tehran, 2006, Tehran, 2007, Tables 2-17 and 2-18.
Ḥabiballāh Zanjāni, Gozida-ye moṭāleʿāt-e jamʿiyati-e majmuʿa-ye šahri-e Tehran, Markaz-e moṭāleʿāt wa taḥqiqāt-e šah-sāzi wa meʿmāri-e Irān, 2nd ed., Tehran, 2003.
Idem, Moṭāleʿāt-e jamʿiyat dar ṭarḥ-e āmāyeš-e sarzamin, Tehran, 2007a.
Idem, Moṭāleʿa va taʿrif-e mojaddad-e jamʿiyat-e majmuʿa-ye šahri-e Tehrān, Markaz-e moṭāleʿāt wa taḥqiqāt-e šah-sāzi wa meʿmāri-e Irān, Tehran, 2007b.
Idem, Pišbinihā-ye jamʿiyati-e manṭaqa-ye Alborz-e jonubi, Markaz-e moṭāleʿāt wa taḥqiqāt-e šah-sāzi wa meʿmāri-e Irān, 2008.
Ḥabib Zanjāni and Ṭāhā Nurollāhi, Jadāvel-e marg o mir-e Irān barāye sāl-e 1375 Š. [1996], Moʾassesa-ye ʿāli-e pažuheš-e taʾmin-e ejtemāʿi, Tehran, 2000.
Ḥabib Zanjāni et al., Sawābeq-e jamʿiyati-e šahrhā wa ābādihā-ye Ostān-e Tehrān dar maḥduda-ye taqsimāt-e kešvari-e saršomari-e 1365 Š. [1986], Markaz-e moṭāleʿāt wa taḥqiqāt-e šah-sāzi wa meʿmāri-e Irān, publication nos. 1-3, Tehran, 1993.
Idem et al., Rāhnemā-ye jamiʿyat-e šahrhā-ye Irān, Markaz-e moṭāleʿāt wa taḥqiqāt-e šah-sāzi wa meʿmāri-e Irān, 2nd ed., Tehran, 2003.
(Habibollah Zanjani)
Originally Published: December 15, 2010
Last Updated: April 24, 2012
This article is available in print.
Vol. XV, Fasc. 5, pp. 538-543